29
/de/
de
AIzaSyAYiBZKx7MnpbEhh9jyipgxe19OcubqV5w
April 1, 2024
136347
Gambia, The
GMB
true
2
1
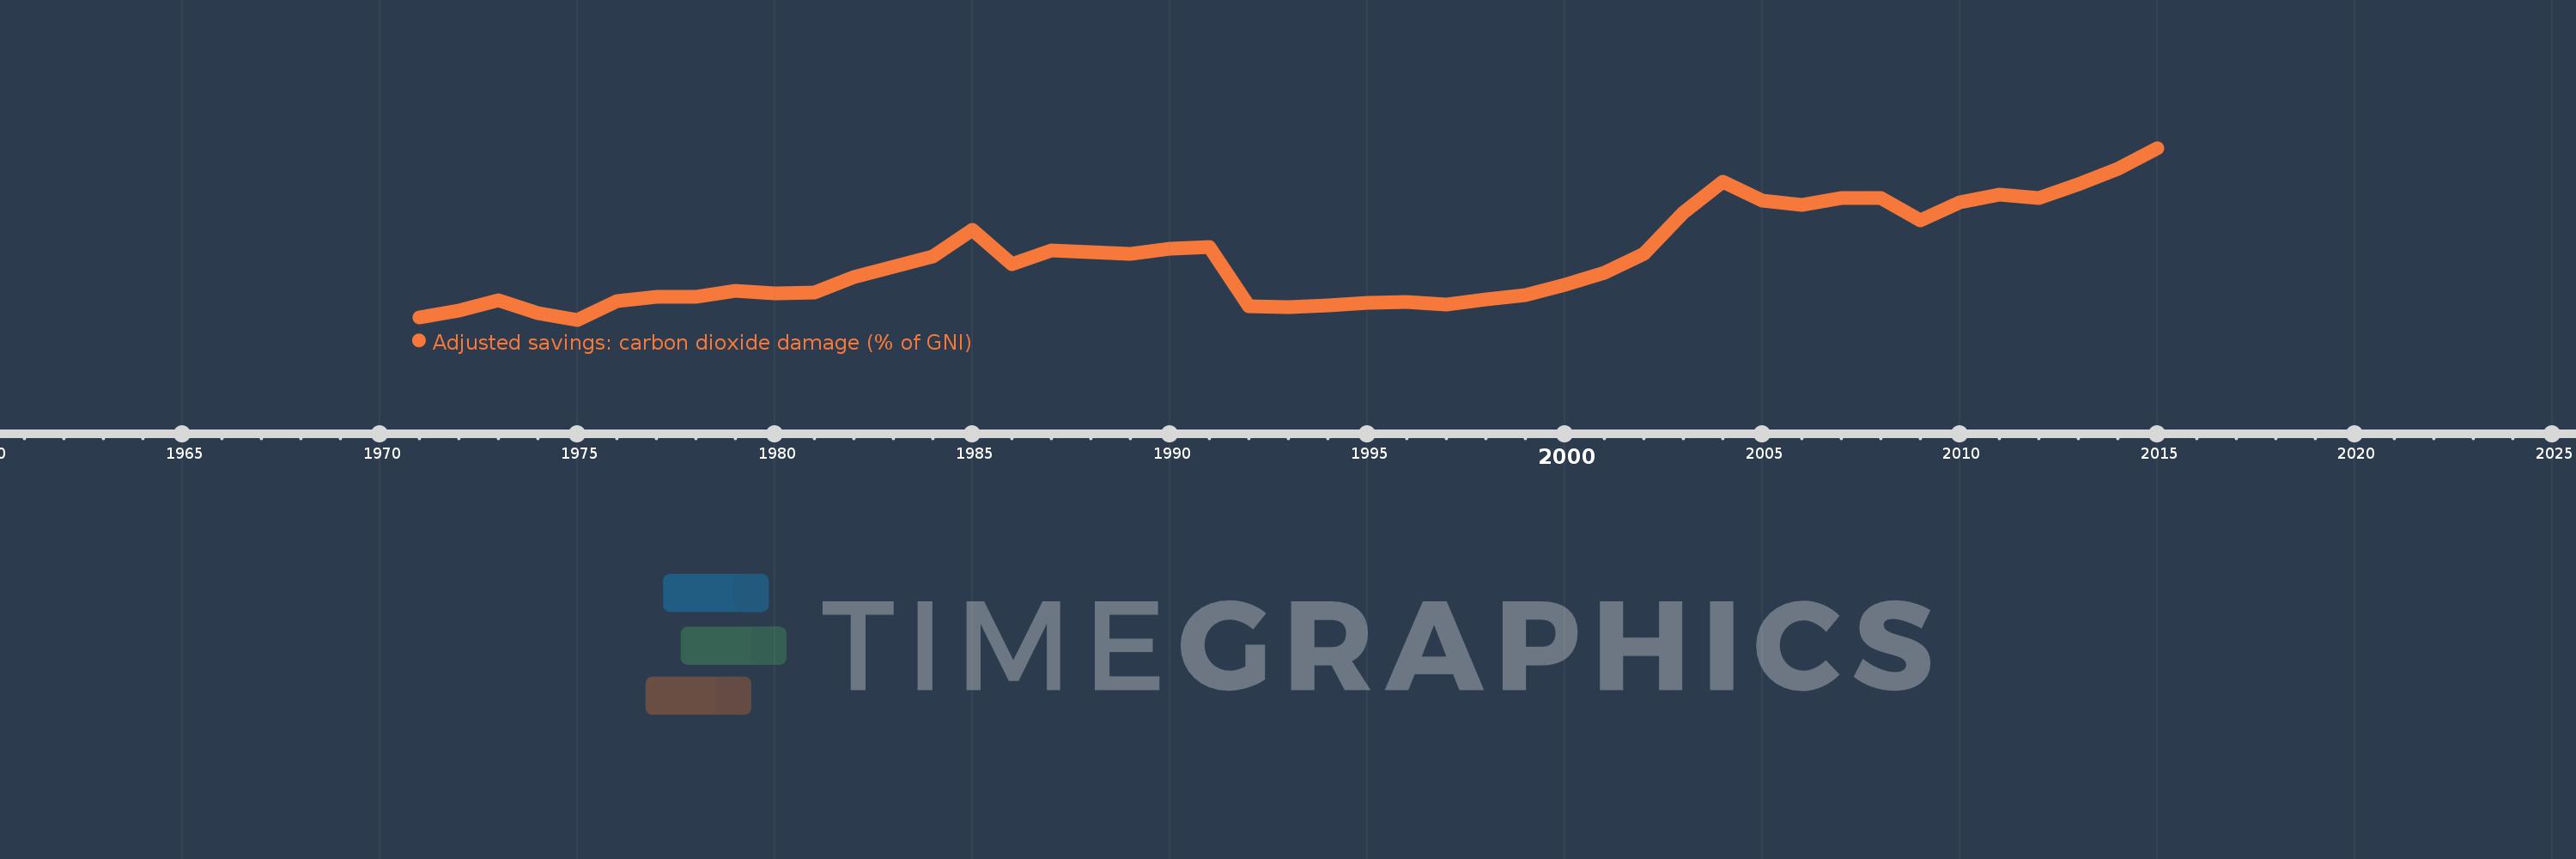
Adjusted savings: carbon dioxide damage (% of GNI)
2015,2014,2013,2012,2011,2010,2009,2008,2007,2006,2005,2004,2003,2002,2001,2000,1999,1998,1997,1996,1995,1994,1993,1992,1991,1990,1989,1988,1987,1986,1985,1984,1983,1982,1981,1980,1979,1978,1977,1976,1975,1974,1973,1972,1971
Diese Statistik in anderen Ländern:
AfghanistanAlbaniaAlgeriaAndorraAngolaAntigua and BarbudaArab WorldArgentinaArmeniaAustraliaAustriaAzerbaijanBahamas, TheBahrainBangladeshBarbadosBelarusBelgiumBelizeBeninBermudaBhutanBoliviaBosnia and HerzegovinaBotswanaBrazilBrunei DarussalamBulgariaBurkina FasoBurundiCabo VerdeCambodiaCameroonCanadaCaribbean small statesCentral African RepublicCentral Europe and the BalticsChadChileChinaColombiaComorosCongo, Dem. Rep.Congo, Rep.Costa RicaCote d'IvoireCroatiaCubaCyprusCzech RepublicDenmarkDjiboutiDominicaDominican RepublicEarly-demographic dividendEast Asia & PacificEast Asia & Pacific (excluding high income)East Asia & Pacific (IDA & IBRD countries)EcuadorEgypt, Arab Rep.El SalvadorEquatorial GuineaEritreaEstoniaEthiopiaEuro areaEurope & Central AsiaEurope & Central Asia (excluding high income)Europe & Central Asia (IDA & IBRD countries)European UnionFaroe IslandsFijiFinlandFragile and conflict affected situationsFranceFrench PolynesiaGabonGambia, TheGeorgiaGermanyGhanaGreeceGreenlandGrenadaGuatemalaGuineaGuinea-BissauGuyanaHaitiHeavily indebted poor countries (HIPC)High incomeHondurasHong Kong SAR, ChinaHungaryIBRD onlyIcelandIDA & IBRD totalIDA blendIDA onlyIDA totalIndiaIndonesiaIran, Islamic Rep.IraqIrelandIsraelItalyJamaicaJapanJordanKazakhstanKenyaKiribatiKorea, Rep.KuwaitKyrgyz RepublicLao PDRLate-demographic dividendLatin America & Caribbean Latin America & Caribbean (excluding high income)Latin America & the Caribbean (IDA & IBRD countries)LatviaLeast developed countries: UN classificationLebanonLesothoLiberiaLibyaLiechtensteinLithuaniaLow & middle incomeLow incomeLower middle incomeLuxembourgMacao SAR, ChinaMacedonia, FYRMadagascarMalawiMalaysiaMaldivesMaliMaltaMarshall IslandsMauritaniaMauritiusMexicoMicronesia, Fed. Sts.Middle East & North AfricaMiddle East & North Africa (excluding high income)Middle East & North Africa (IDA & IBRD countries)Middle incomeMoldovaMongoliaMontenegroMoroccoMozambiqueNamibiaNepalNetherlandsNew CaledoniaNew ZealandNicaraguaNigerNigeriaNorth AmericaNorwayOECD membersOmanOther small statesPacific island small statesPakistanPalauPanamaPapua New GuineaParaguayPeruPhilippinesPolandPortugalPost-demographic dividendPre-demographic dividendQatarRomaniaRussian FederationRwandaSamoaSao Tome and PrincipeSaudi ArabiaSenegalSerbiaSeychellesSierra LeoneSingaporeSlovak RepublicSloveniaSmall statesSolomon IslandsSouth AfricaSouth AsiaSouth Asia (IDA & IBRD)SpainSri LankaSt. Kitts and NevisSt. LuciaSt. Vincent and the GrenadinesSub-Saharan Africa Sub-Saharan Africa (excluding high income)Sub-Saharan Africa (IDA & IBRD countries)SudanSurinameSwazilandSwedenSwitzerlandSyrian Arab RepublicTajikistanTanzaniaThailandTimor-LesteTogoTongaTrinidad and TobagoTunisiaTurkeyTurkmenistanUgandaUkraineUnited Arab EmiratesUnited KingdomUnited StatesUpper middle incomeUruguayUzbekistanVanuatuVenezuela, RBVietnamWest Bank and GazaWorldYemen, Rep.ZambiaZimbabwe Zeitlinie:
Diese Zeitleiste vorliegt die Graphik ab 1971 J. bis 2015 J. Gambia, The. Die Angaben bis 1970 J. sind nicht vorhanden. Die Zahl aktueller Beobachtungen nach Daten: 45.
Die Quelle (Bezeichnung):
Kennzahlen der Weltentwicklung
Die Quelle (Einrichtung):
World Bank staff estimates based on Samuel Fankhauser's "Valuing Climate Change: The Economics of the Greenhouse" (1995).
Kategorien:
Economy & Growth, Environment
Es wurde aktualisiert:
23 Apr 2017 Jahr
Kennzahlen der Wertänderungen vom Jahr zum Jahr
Minimum:
0.116
1 Jan 1975 Jahr
Maximum:
0.602
1 Jan 2015 Jahr
Zum Datum der Beobachtung
Wert
Absolute Veränderung
Die Veränderung bezüglich dem vorherigen Wert
1 Jan 1971 Jahr
0.122
+0.122
0.0%
1 Jan 1972 Jahr
0.143
+0.022
17.8%
1 Jan 1973 Jahr
0.172
+0.028
19.87%
1 Jan 1974 Jahr
0.135
-0.037
-21.54%
1 Jan 1975 Jahr
0.116
-0.019
-13.97%
1 Jan 1976 Jahr
0.168
+0.052
44.86%
1 Jan 1977 Jahr
0.182
+0.014
8.16%
1 Jan 1978 Jahr
0.182
+0.0
0.0%
1 Jan 1979 Jahr
0.197
+0.015
8.31%
1 Jan 1980 Jahr
0.19
-0.007
-3.44%
1 Jan 1981 Jahr
0.194
+0.004
2.29%
1 Jan 1982 Jahr
0.237
+0.043
21.9%
1 Jan 1983 Jahr
0.267
+0.03
12.8%
1 Jan 1984 Jahr
0.295
+0.028
10.41%
1 Jan 1985 Jahr
0.37
+0.075
25.26%
1 Jan 1986 Jahr
0.274
-0.095
-25.79%
1 Jan 1987 Jahr
0.311
+0.036
13.22%
1 Jan 1988 Jahr
0.307
-0.004
-1.19%
1 Jan 1989 Jahr
0.302
-0.005
-1.57%
1 Jan 1990 Jahr
0.317
+0.015
4.8%
1 Jan 1991 Jahr
0.323
+0.007
2.06%
1 Jan 1992 Jahr
0.153
-0.171
-52.77%
1 Jan 1993 Jahr
0.152
0.0
-0.31%
1 Jan 1994 Jahr
0.157
+0.005
3.33%
1 Jan 1995 Jahr
0.164
+0.007
4.41%
1 Jan 1996 Jahr
0.166
+0.002
1.06%
1 Jan 1997 Jahr
0.158
-0.008
-4.59%
1 Jan 1998 Jahr
0.174
+0.016
9.8%
1 Jan 1999 Jahr
0.185
+0.011
6.16%
1 Jan 2000 Jahr
0.215
+0.03
16.52%
1 Jan 2001 Jahr
0.249
+0.034
15.75%
1 Jan 2002 Jahr
0.303
+0.054
21.86%
1 Jan 2003 Jahr
0.419
+0.115
38.07%
1 Jan 2004 Jahr
0.507
+0.089
21.19%
1 Jan 2005 Jahr
0.454
-0.053
-10.46%
1 Jan 2006 Jahr
0.442
-0.012
-2.74%
1 Jan 2007 Jahr
0.461
+0.02
4.42%
1 Jan 2008 Jahr
0.46
-0.002
-0.36%
1 Jan 2009 Jahr
0.398
-0.062
-13.46%
1 Jan 2010 Jahr
0.449
+0.051
12.88%
1 Jan 2011 Jahr
0.471
+0.022
4.79%
1 Jan 2012 Jahr
0.46
-0.011
-2.27%
1 Jan 2013 Jahr
0.498
+0.038
8.24%
1 Jan 2014 Jahr
0.543
+0.045
8.99%
1 Jan 2015 Jahr
0.602
+0.059
10.88%
Bewertung der Länder gemäß mit laufender Statistik nach Jahren


Kommentare: