29
/de/
de
AIzaSyAYiBZKx7MnpbEhh9jyipgxe19OcubqV5w
April 1, 2024
136336
Gambia, The
GMB
true
2
1
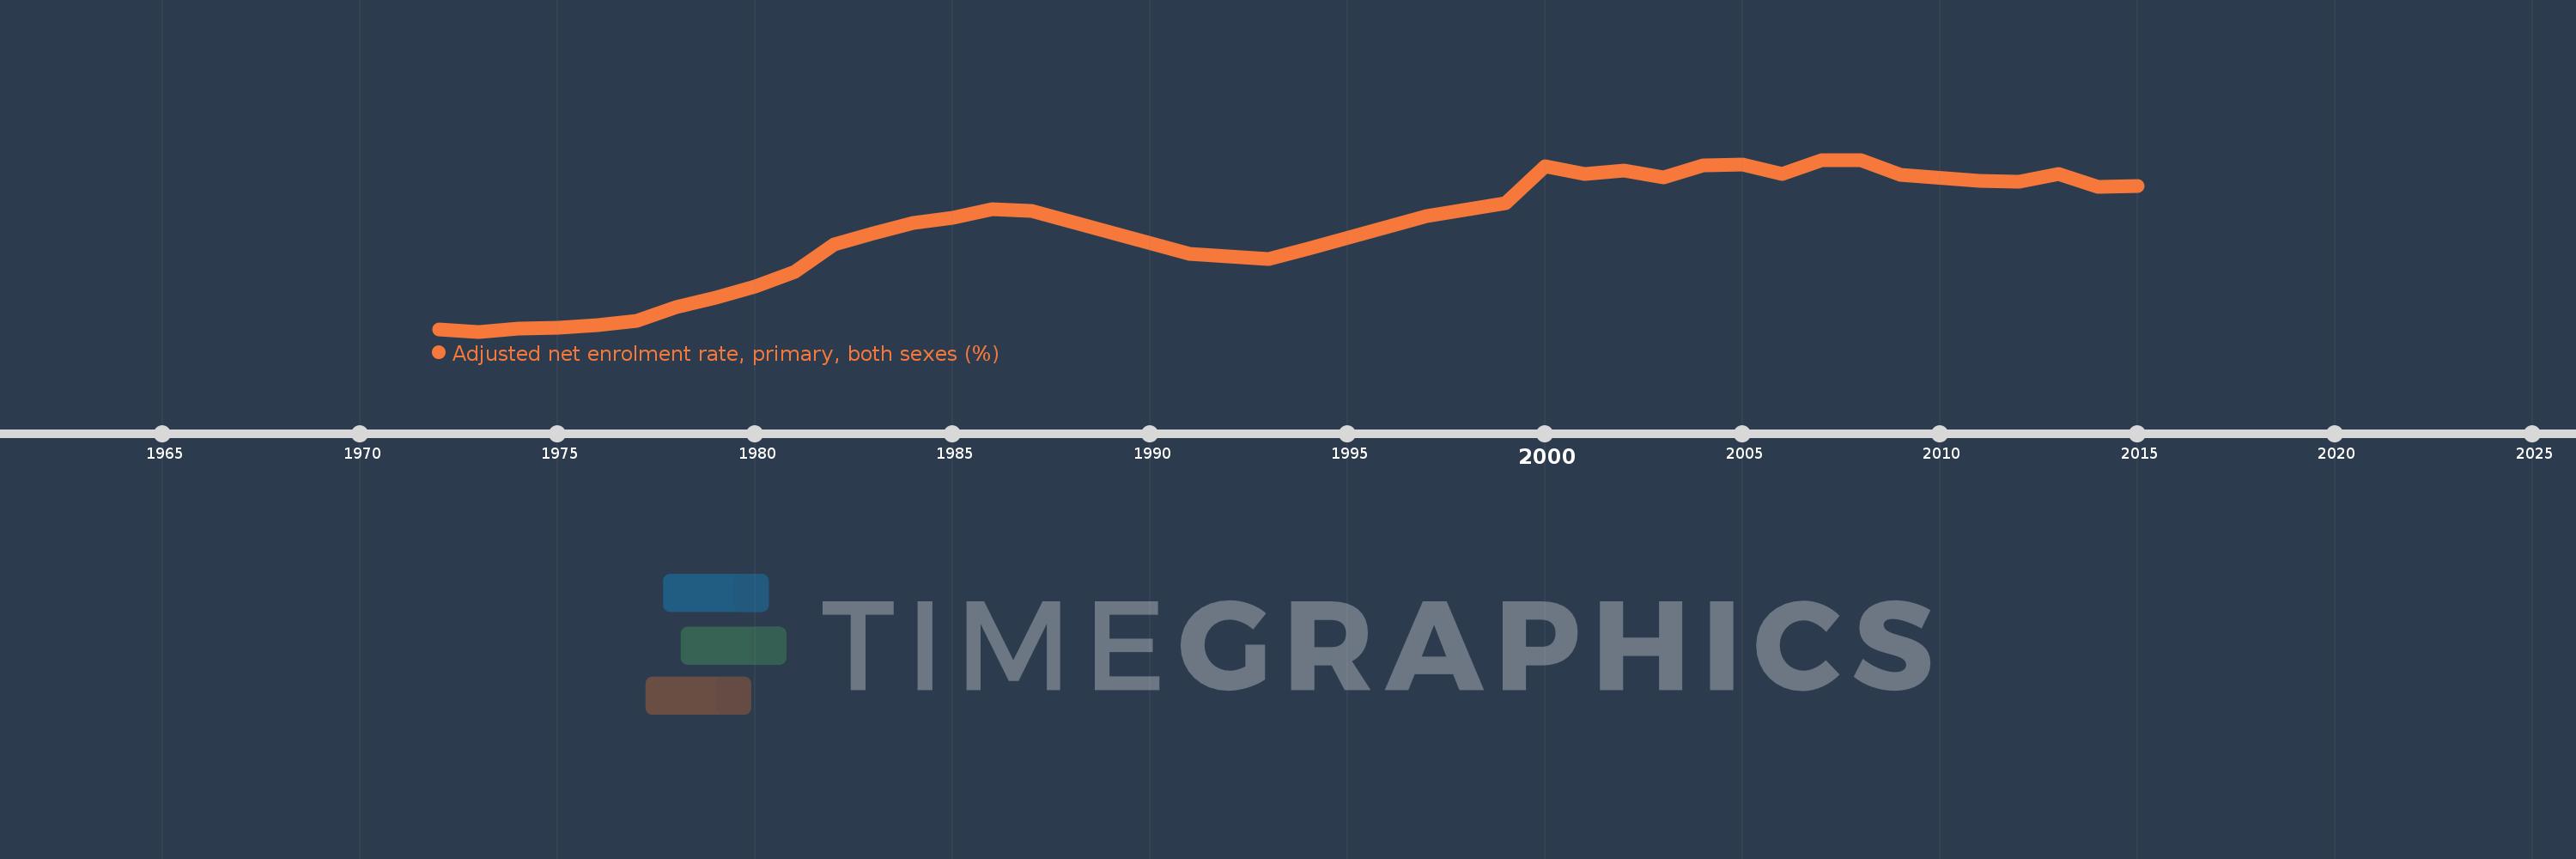
Adjusted net enrolment rate, primary, both sexes (%)
2015,2014,2013,2012,2011,2009,2008,2007,2006,2005,2004,2003,2002,2001,2000,1999,1997,1994,1993,1991,1987,1986,1985,1984,1983,1982,1981,1980,1979,1978,1977,1976,1975,1974,1973,1972
Diese Statistik in anderen Ländern:
AfghanistanAlbaniaAlgeriaAngolaAntigua and BarbudaArab WorldArgentinaArmeniaArubaAustraliaAustriaAzerbaijanBahamas, TheBahrainBangladeshBarbadosBelarusBelgiumBelizeBeninBermudaBhutanBoliviaBosnia and HerzegovinaBotswanaBrazilBrunei DarussalamBulgariaBurkina FasoBurundiCabo VerdeCambodiaCameroonCanadaCaribbean small statesCentral African RepublicCentral Europe and the BalticsChadChileChinaColombiaComorosCongo, Dem. Rep.Congo, Rep.Costa RicaCote d'IvoireCroatiaCubaCyprusDenmarkDjiboutiDominicaDominican RepublicEarly-demographic dividendEast Asia & PacificEast Asia & Pacific (excluding high income)East Asia & Pacific (IDA & IBRD countries)EcuadorEgypt, Arab Rep.El SalvadorEquatorial GuineaEritreaEstoniaEthiopiaEuro areaEurope & Central AsiaEurope & Central Asia (excluding high income)Europe & Central Asia (IDA & IBRD countries)European UnionFijiFinlandFragile and conflict affected situationsFranceGabonGambia, TheGeorgiaGermanyGhanaGreeceGrenadaGuatemalaGuineaGuinea-BissauGuyanaHaitiHeavily indebted poor countries (HIPC)High incomeHondurasHong Kong SAR, ChinaHungaryIBRD onlyIcelandIDA & IBRD totalIDA blendIDA onlyIDA totalIndiaIndonesiaIran, Islamic Rep.IraqIrelandIsraelItalyJamaicaJapanJordanKazakhstanKenyaKiribatiKorea, Dem. People’s Rep.Korea, Rep.KuwaitKyrgyz RepublicLao PDRLate-demographic dividendLatin America & Caribbean Latin America & Caribbean (excluding high income)Latin America & the Caribbean (IDA & IBRD countries)LatviaLeast developed countries: UN classificationLebanonLesothoLiberiaLibyaLiechtensteinLithuaniaLow & middle incomeLow incomeLower middle incomeLuxembourgMacao SAR, ChinaMacedonia, FYRMadagascarMalawiMalaysiaMaldivesMaliMaltaMarshall IslandsMauritaniaMauritiusMexicoMicronesia, Fed. Sts.Middle East & North AfricaMiddle East & North Africa (excluding high income)Middle East & North Africa (IDA & IBRD countries)Middle incomeMoldovaMongoliaMontenegroMoroccoMozambiqueMyanmarNamibiaNauruNepalNetherlandsNew ZealandNicaraguaNigerNigeriaNorth AmericaNorwayOECD membersOmanOther small statesPacific island small statesPakistanPalauPanamaPapua New GuineaParaguayPeruPhilippinesPolandPortugalPost-demographic dividendPre-demographic dividendPuerto RicoQatarRomaniaRussian FederationRwandaSamoaSan MarinoSao Tome and PrincipeSaudi ArabiaSenegalSerbiaSeychellesSierra LeoneSloveniaSmall statesSolomon IslandsSomaliaSouth AfricaSouth AsiaSouth Asia (IDA & IBRD)South SudanSpainSri LankaSt. Kitts and NevisSt. LuciaSt. Vincent and the GrenadinesSub-Saharan Africa Sub-Saharan Africa (excluding high income)Sub-Saharan Africa (IDA & IBRD countries)SudanSurinameSwazilandSwedenSwitzerlandSyrian Arab RepublicTajikistanTanzaniaThailandTimor-LesteTogoTongaTrinidad and TobagoTunisiaTurkeyTuvaluUgandaUkraineUnited Arab EmiratesUnited KingdomUnited StatesUpper middle incomeUruguayUzbekistanVanuatuVenezuela, RBVietnamWest Bank and GazaWorldYemen, Rep.ZambiaZimbabwe Zeitlinie:
Diese Zeitleiste vorliegt die Graphik ab 1972 J. bis 2015 J. Gambia, The. Die Angaben bis 1971 J. sind nicht vorhanden. Die Zahl aktueller Beobachtungen nach Daten: 36.
Die Quelle (Bezeichnung):
Kennzahlen der Weltentwicklung
Die Quelle (Einrichtung):
UNESCO Institute for Statistics
Kategorien:
Education
Es wurde aktualisiert:
23 Apr 2017 Jahr
Kennzahlen der Wertänderungen vom Jahr zum Jahr
Minimum:
23.301
1 Jan 1973 Jahr
Maximum:
77.174
1 Jan 2007 Jahr
Zum Datum der Beobachtung
Wert
Absolute Veränderung
Die Veränderung bezüglich dem vorherigen Wert
1 Jan 1972 Jahr
24.067
+24.067
0.0%
1 Jan 1973 Jahr
23.301
-0.766
-3.18%
1 Jan 1974 Jahr
24.279
+0.978
4.2%
1 Jan 1975 Jahr
24.494
+0.214
0.88%
1 Jan 1976 Jahr
25.436
+0.942
3.85%
1 Jan 1977 Jahr
26.73
+1.294
5.09%
1 Jan 1978 Jahr
31.024
+4.294
16.06%
1 Jan 1979 Jahr
33.949
+2.925
9.43%
1 Jan 1980 Jahr
37.513
+3.564
10.5%
1 Jan 1981 Jahr
42.024
+4.511
12.03%
1 Jan 1982 Jahr
50.667
+8.643
20.57%
1 Jan 1983 Jahr
54.266
+3.599
7.1%
1 Jan 1984 Jahr
57.488
+3.222
5.94%
1 Jan 1985 Jahr
59.093
+1.604
2.79%
1 Jan 1986 Jahr
61.672
+2.579
4.36%
1 Jan 1987 Jahr
61.072
-0.6
-0.97%
1 Jan 1991 Jahr
47.793
-13.279
-21.74%
1 Jan 1993 Jahr
45.994
-1.799
-3.76%
1 Jan 1994 Jahr
49.305
+3.311
7.2%
1 Jan 1997 Jahr
59.464
+10.159
20.6%
1 Jan 1999 Jahr
63.517
+4.053
6.82%
1 Jan 2000 Jahr
75.104
+11.587
18.24%
1 Jan 2001 Jahr
72.763
-2.341
-3.12%
1 Jan 2002 Jahr
73.734
+0.971
1.33%
1 Jan 2003 Jahr
71.681
-2.053
-2.78%
1 Jan 2004 Jahr
75.409
+3.728
5.2%
1 Jan 2005 Jahr
75.575
+0.166
0.22%
1 Jan 2006 Jahr
72.738
-2.836
-3.75%
1 Jan 2007 Jahr
77.174
+4.436
6.1%
1 Jan 2008 Jahr
76.916
-0.258
-0.33%
1 Jan 2009 Jahr
72.506
-4.41
-5.73%
1 Jan 2011 Jahr
70.525
-1.981
-2.73%
1 Jan 2012 Jahr
70.367
-0.158
-0.22%
1 Jan 2013 Jahr
72.713
+2.346
3.33%
1 Jan 2014 Jahr
68.604
-4.108
-5.65%
1 Jan 2015 Jahr
69.039
+0.434
0.63%
Bewertung der Länder gemäß mit laufender Statistik nach Jahren


Kommentare: