29
/de/
de
AIzaSyAYiBZKx7MnpbEhh9jyipgxe19OcubqV5w
April 1, 2024
131306
Ethiopia
ETH
true
2
1
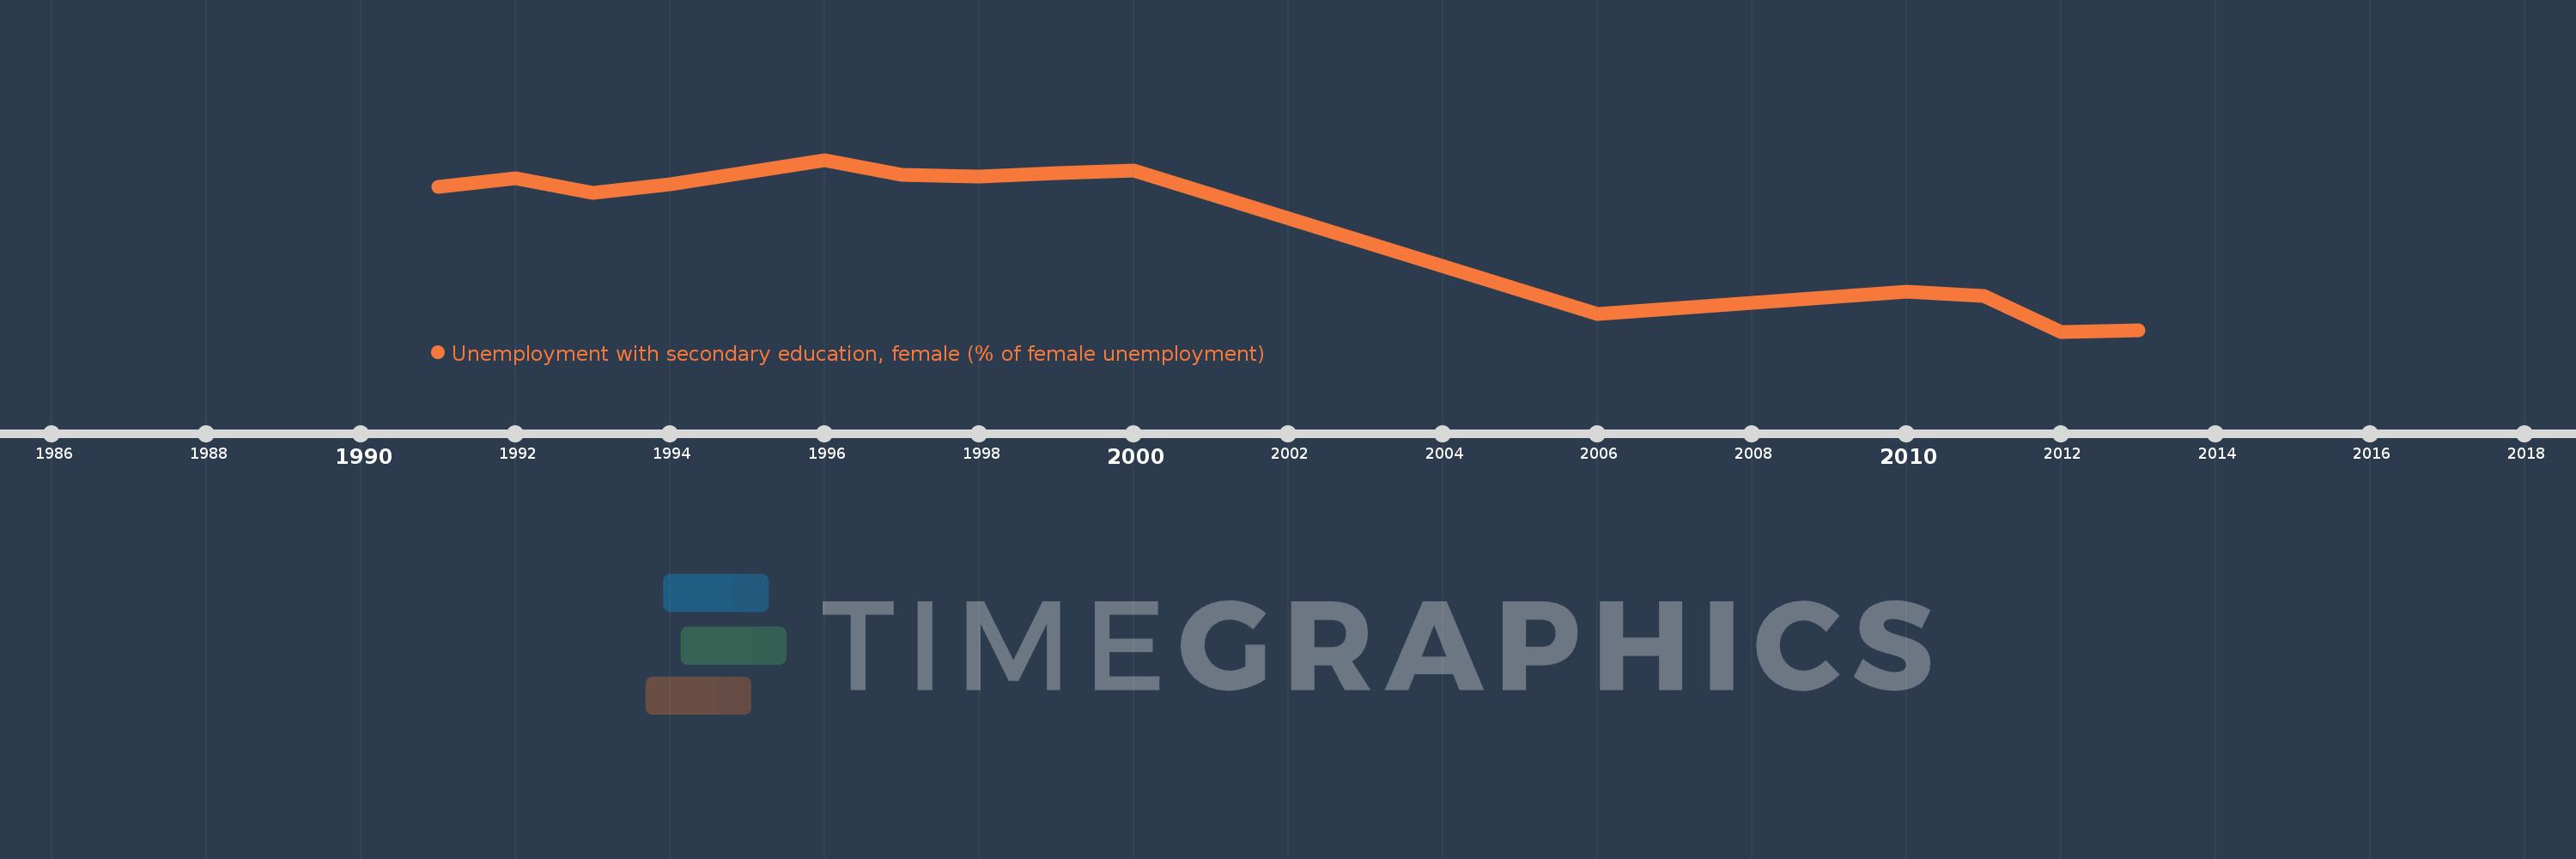
Unemployment with secondary education, female (% of female unemployment)
2013,2012,2011,2010,2006,2000,1999,1998,1997,1996,1995,1994,1993,1992,1991
Diese Statistik in anderen Ländern:
Zeitlinie:
Diese Zeitleiste vorliegt die Graphik ab 1991 J. bis 2013 J. Ethiopia. Die Angaben bis 1990 J. sind nicht vorhanden. Die Zahl aktueller Beobachtungen nach Daten: 15.
Die Quelle (Bezeichnung):
Kennzahlen der Weltentwicklung
Die Quelle (Einrichtung):
International Labour Organization, Key Indicators of the Labour Market database.
Kategorien:
Social Protection & Labor, Gender
Es wurde aktualisiert:
23 Apr 2017 Jahr
Kennzahlen der Wertänderungen vom Jahr zum Jahr
Minimum:
4.5
1 Jan 2012 Jahr
Maximum:
70.7
1 Jan 1996 Jahr
Zum Datum der Beobachtung
Wert
Absolute Veränderung
Die Veränderung bezüglich dem vorherigen Wert
1 Jan 1991 Jahr
60.3
+60.3
0.0%
1 Jan 1992 Jahr
63.7
+3.4
5.64%
1 Jan 1993 Jahr
58.1
-5.6
-8.79%
1 Jan 1994 Jahr
61.4
+3.3
5.68%
1 Jan 1995 Jahr
66.0
+4.6
7.49%
1 Jan 1996 Jahr
70.7
+4.7
7.12%
1 Jan 1997 Jahr
64.8
-5.9
-8.35%
1 Jan 1998 Jahr
64.4
-0.4
-0.62%
1 Jan 1999 Jahr
65.6
+1.2
1.86%
1 Jan 2000 Jahr
66.7
+1.1
1.68%
1 Jan 2006 Jahr
11.3
-55.4
-83.06%
1 Jan 2010 Jahr
19.9
+8.6
76.11%
1 Jan 2011 Jahr
18.1
-1.8
-9.05%
1 Jan 2012 Jahr
4.5
-13.6
-75.14%
1 Jan 2013 Jahr
4.9
+0.4
8.89%
Bewertung der Länder gemäß mit laufender Statistik nach Jahren


Kommentare: