29
/de/
de
AIzaSyAYiBZKx7MnpbEhh9jyipgxe19OcubqV5w
April 1, 2024
131279
Ethiopia
ETH
true
2
1
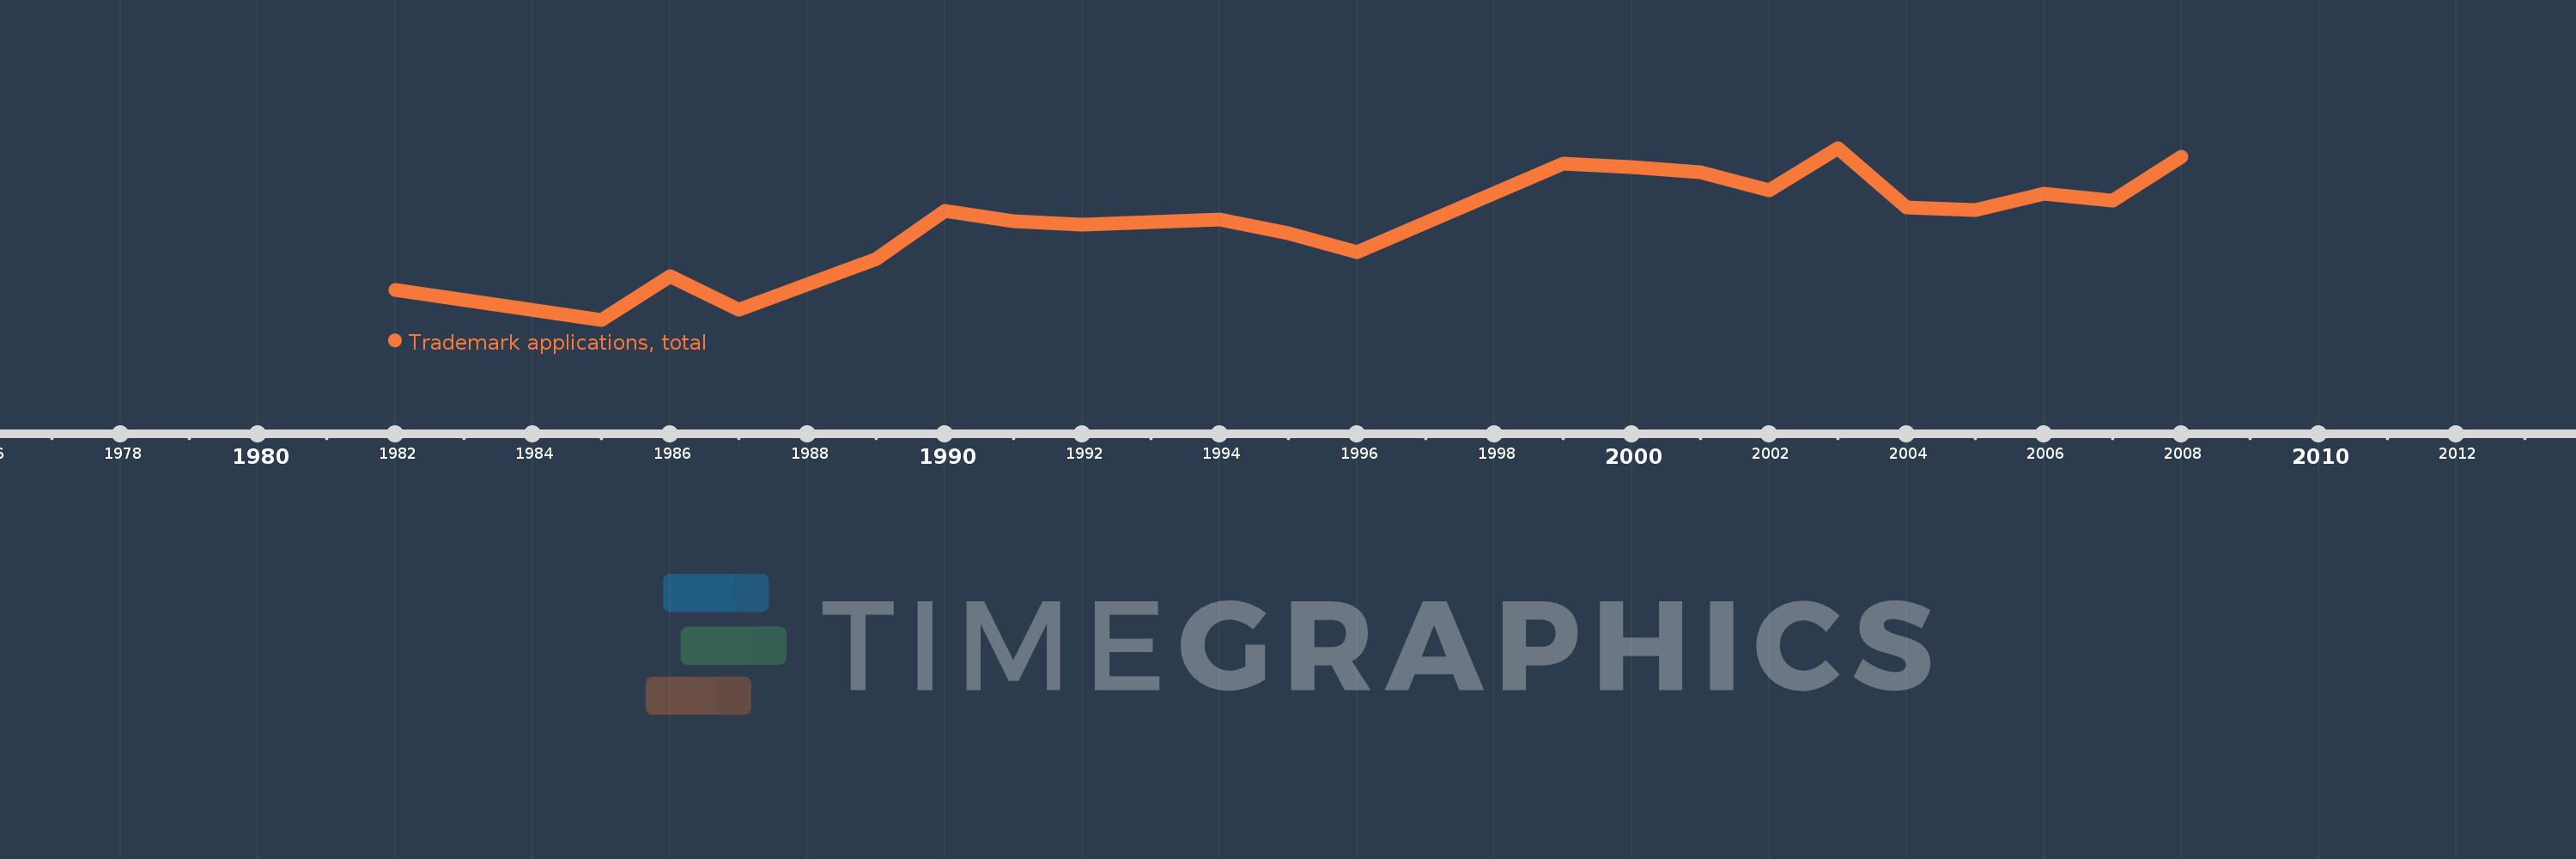
Trademark applications, total
2008,2007,2006,2005,2004,2003,2002,2001,2000,1999,1996,1995,1994,1992,1991,1990,1989,1987,1986,1985,1982
Diese Statistik in anderen Ländern:
AlbaniaAlgeriaAndorraAngolaAntigua and BarbudaArab WorldArgentinaArmeniaArubaAustraliaAustriaAzerbaijanBahamas, TheBahrainBangladeshBarbadosBelarusBelgiumBelizeBhutanBoliviaBosnia and HerzegovinaBotswanaBrazilBrunei DarussalamBulgariaBurkina FasoBurundiCabo VerdeCambodiaCanadaCaribbean small statesCentral Europe and the BalticsChileChinaColombiaComorosCongo, Dem. Rep.Costa RicaCroatiaCubaCuracaoCyprusCzech RepublicDenmarkDjiboutiDominicaDominican RepublicEarly-demographic dividendEast Asia & PacificEast Asia & Pacific (excluding high income)East Asia & Pacific (IDA & IBRD countries)EcuadorEgypt, Arab Rep.El SalvadorEquatorial GuineaEstoniaEthiopiaEuro areaEurope & Central AsiaEurope & Central Asia (excluding high income)Europe & Central Asia (IDA & IBRD countries)European UnionFijiFinlandFranceGambia, TheGeorgiaGermanyGhanaGreeceGrenadaGuatemalaGuineaGuinea-BissauGuyanaHaitiHigh incomeHondurasHong Kong SAR, ChinaHungaryIBRD onlyIcelandIDA & IBRD totalIDA blendIDA onlyIDA totalIndiaIndonesiaIran, Islamic Rep.IraqIrelandIsraelItalyJamaicaJapanJordanKazakhstanKenyaKiribatiKorea, Dem. People’s Rep.Korea, Rep.KuwaitKyrgyz RepublicLao PDRLate-demographic dividendLatin America & Caribbean Latin America & Caribbean (excluding high income)Latin America & the Caribbean (IDA & IBRD countries)LatviaLeast developed countries: UN classificationLebanonLesothoLiberiaLibyaLiechtensteinLithuaniaLow & middle incomeLower middle incomeLuxembourgMacao SAR, ChinaMacedonia, FYRMadagascarMalawiMalaysiaMaldivesMaliMaltaMauritiusMexicoMiddle East & North AfricaMiddle East & North Africa (excluding high income)Middle East & North Africa (IDA & IBRD countries)Middle incomeMoldovaMonacoMongoliaMontenegroMoroccoMozambiqueMyanmarNamibiaNepalNetherlandsNew ZealandNicaraguaNigeriaNorth AmericaNorwayOECD membersOmanOther small statesPacific island small statesPakistanPanamaPapua New GuineaParaguayPeruPhilippinesPolandPortugalPost-demographic dividendQatarRomaniaRussian FederationRwandaSamoaSan MarinoSao Tome and PrincipeSaudi ArabiaSerbiaSeychellesSierra LeoneSingaporeSint Maarten (Dutch part)Slovak RepublicSloveniaSmall statesSolomon IslandsSomaliaSouth AfricaSouth AsiaSouth Asia (IDA & IBRD)SpainSri LankaSt. LuciaSt. Vincent and the GrenadinesSudanSurinameSwazilandSwedenSwitzerlandSyrian Arab RepublicTajikistanTanzaniaThailandTongaTrinidad and TobagoTunisiaTurkeyTurkmenistanTuvaluUgandaUkraineUnited Arab EmiratesUnited KingdomUnited StatesUpper middle incomeUruguayUzbekistanVenezuela, RBVietnamWorldYemen, Rep.ZambiaZimbabwe Zeitlinie:
Diese Zeitleiste vorliegt die Graphik ab 1982 J. bis 2008 J. Ethiopia. Die Angaben bis 1981 J. sind nicht vorhanden. Die Zahl aktueller Beobachtungen nach Daten: 21.
Die Quelle (Bezeichnung):
Kennzahlen der Weltentwicklung
Die Quelle (Einrichtung):
World Intellectual Property Organization (WIPO), World Intellectual Property Indicators and www.wipo.int/econ_stat. The International Bureau of WIPO assumes no responsibility with respect to the transformation of these data.
Kategorien:
Science & Technology
Es wurde aktualisiert:
23 Apr 2017 Jahr
Kennzahlen der Wertänderungen vom Jahr zum Jahr
Minimum:
77.0
1 Jan 1985 Jahr
Maximum:
753.0
1 Jan 2003 Jahr
Zum Datum der Beobachtung
Wert
Absolute Veränderung
Die Veränderung bezüglich dem vorherigen Wert
1 Jan 1982 Jahr
195.0
+195.0
0.0%
1 Jan 1985 Jahr
77.0
-118.0
-60.51%
1 Jan 1986 Jahr
249.0
+172.0
223.38%
1 Jan 1987 Jahr
117.0
-132.0
-53.01%
1 Jan 1989 Jahr
316.0
+199.0
170.09%
1 Jan 1990 Jahr
506.0
+190.0
60.13%
1 Jan 1991 Jahr
466.0
-40.0
-7.91%
1 Jan 1992 Jahr
452.0
-14.0
-3.0%
1 Jan 1994 Jahr
473.0
+21.0
4.65%
1 Jan 1995 Jahr
417.0
-56.0
-11.84%
1 Jan 1996 Jahr
342.0
-75.0
-17.99%
1 Jan 1999 Jahr
692.0
+350.0
102.34%
1 Jan 2000 Jahr
679.0
-13.0
-1.88%
1 Jan 2001 Jahr
659.0
-20.0
-2.95%
1 Jan 2002 Jahr
588.0
-71.0
-10.77%
1 Jan 2003 Jahr
753.0
+165.0
28.06%
1 Jan 2004 Jahr
520.0
-233.0
-30.94%
1 Jan 2005 Jahr
510.0
-10.0
-1.92%
1 Jan 2006 Jahr
574.0
+64.0
12.55%
1 Jan 2007 Jahr
546.0
-28.0
-4.88%
1 Jan 2008 Jahr
719.0
+173.0
31.68%
Bewertung der Länder gemäß mit laufender Statistik nach Jahren


Kommentare: