29
/de/
de
AIzaSyAYiBZKx7MnpbEhh9jyipgxe19OcubqV5w
April 1, 2024
123837
Ecuador
ECU
true
2
1
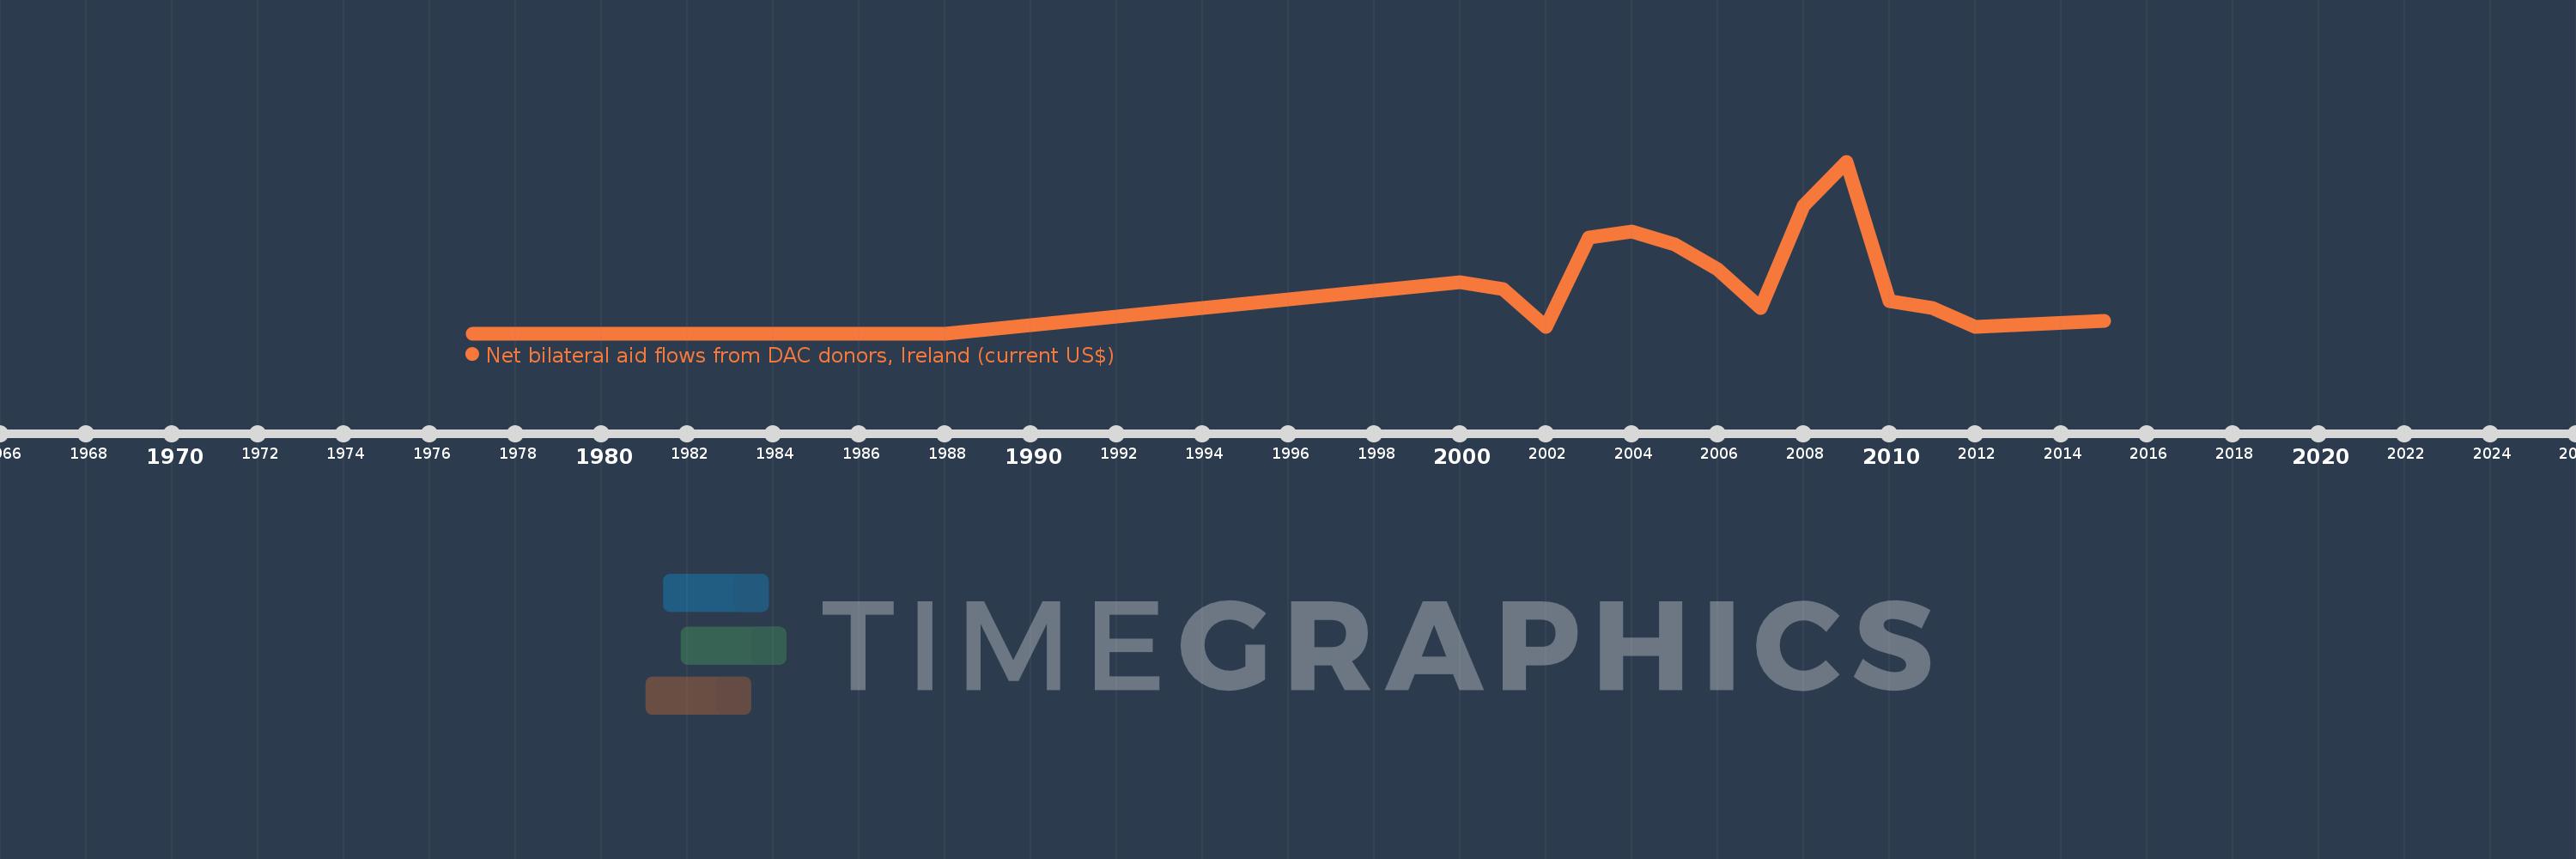
Net bilateral aid flows from DAC donors, Ireland (current US$)
2015,2012,2011,2010,2009,2008,2007,2006,2005,2004,2003,2002,2001,2000,1988,1987,1986,1985,1984,1983,1982,1981,1979,1978,1977
Diese Statistik in anderen Ländern:
AfghanistanAlbaniaAlgeriaAngolaArab WorldArgentinaArmeniaAzerbaijanBangladeshBelarusBelizeBeninBhutanBoliviaBosnia and HerzegovinaBotswanaBrazilBulgariaBurkina FasoBurundiCambodiaCameroonCaribbean small statesCentral African RepublicCentral Europe and the BalticsChadChileChinaColombiaComorosCongo, Dem. Rep.Congo, Rep.Costa RicaCote d'IvoireCroatiaCubaCzech RepublicDjiboutiDominican RepublicEast Asia & PacificEast Asia & Pacific (excluding high income)East Asia & Pacific (IDA & IBRD countries)EcuadorEgypt, Arab Rep.El SalvadorEquatorial GuineaEritreaEthiopiaEuro areaEurope & Central AsiaEurope & Central Asia (excluding high income)Europe & Central Asia (IDA & IBRD countries)European UnionFijiFragile and conflict affected situationsGabonGambia, TheGeorgiaGhanaGrenadaGuatemalaGuineaGuinea-BissauGuyanaHaitiHeavily indebted poor countries (HIPC)High incomeHondurasHong Kong SAR, ChinaHungaryIBRD onlyIDA & IBRD totalIDA blendIDA onlyIDA totalIndiaIndonesiaIran, Islamic Rep.IraqIsraelJamaicaJordanKazakhstanKenyaKorea, Dem. People’s Rep.Korea, Rep.KosovoKyrgyz RepublicLao PDRLatin America & Caribbean Latin America & Caribbean (excluding high income)Latin America & the Caribbean (IDA & IBRD countries)LatviaLeast developed countries: UN classificationLebanonLesothoLiberiaLibyaLithuaniaLow & middle incomeLow incomeLower middle incomeMacedonia, FYRMadagascarMalawiMalaysiaMaldivesMaliMauritaniaMauritiusMexicoMicronesia, Fed. Sts.Middle East & North AfricaMiddle East & North Africa (excluding high income)Middle East & North Africa (IDA & IBRD countries)Middle incomeMoldovaMongoliaMontenegroMoroccoMozambiqueMyanmarNamibiaNepalNicaraguaNigerNigeriaOECD membersOther small statesPacific island small statesPakistanPanamaPapua New GuineaParaguayPeruPhilippinesPolandRomaniaRussian FederationRwandaSamoaSao Tome and PrincipeSenegalSerbiaSeychellesSierra LeoneSlovak RepublicSloveniaSmall statesSolomon IslandsSomaliaSouth AfricaSouth AsiaSouth Asia (IDA & IBRD)South SudanSri LankaSt. LuciaSub-Saharan Africa Sub-Saharan Africa (excluding high income)Sub-Saharan Africa (IDA & IBRD countries)SudanSurinameSwazilandSyrian Arab RepublicTajikistanTanzaniaThailandTimor-LesteTogoTrinidad and TobagoTunisiaTurkeyTurkmenistanUgandaUkraineUpper middle incomeUruguayUzbekistanVanuatuVenezuela, RBVietnamWest Bank and GazaWorldYemen, Rep.ZambiaZimbabwe Zeitlinie:
Diese Zeitleiste vorliegt die Graphik ab 1977 J. bis 2015 J. Ecuador. Die Angaben bis 1976 J. sind nicht vorhanden. Die Zahl aktueller Beobachtungen nach Daten: 25.
Die Quelle (Bezeichnung):
Kennzahlen der Weltentwicklung
Die Quelle (Einrichtung):
Development Assistance Committee of the Organisation for Economic Co-operation and Development, Geographical Distribution of Financial Flows to Developing Countries, Development Co-operation Report, and International Development Statistics database. Data are available online at: www.oecd.org/dac/stats/idsonline.
Kategorien:
Aid Effectiveness
Es wurde aktualisiert:
23 Apr 2017 Jahr
Kennzahlen der Wertänderungen vom Jahr zum Jahr
im Durchschnitt:
63.6 Tsnd.
Minimum:
10.0 Tsnd.
1 Jan 1977 Jahr
Maximum:
280.0 Tsnd.
1 Jan 2009 Jahr
Zum Datum der Beobachtung
Wert
Absolute Veränderung
Die Veränderung bezüglich dem vorherigen Wert
1 Jan 1977 Jahr
10.0 Tsnd.
+10.0 Tsnd.
0.0%
1 Jan 1978 Jahr
10.0 Tsnd.
0.0
0.0%
1 Jan 1979 Jahr
10.0 Tsnd.
0.0
0.0%
1 Jan 1981 Jahr
10.0 Tsnd.
0.0
0.0%
1 Jan 1982 Jahr
10.0 Tsnd.
0.0
0.0%
1 Jan 1983 Jahr
10.0 Tsnd.
0.0
0.0%
1 Jan 1984 Jahr
10.0 Tsnd.
0.0
0.0%
1 Jan 1985 Jahr
10.0 Tsnd.
0.0
0.0%
1 Jan 1986 Jahr
10.0 Tsnd.
0.0
0.0%
1 Jan 1987 Jahr
10.0 Tsnd.
0.0
0.0%
1 Jan 1988 Jahr
10.0 Tsnd.
0.0
0.0%
1 Jan 2000 Jahr
90.0 Tsnd.
+80.0 Tsnd.
800.0%
1 Jan 2001 Jahr
80.0 Tsnd.
-10.0 Tsnd.
-11.11%
1 Jan 2002 Jahr
20.0 Tsnd.
-60.0 Tsnd.
-75.0%
1 Jan 2003 Jahr
160.0 Tsnd.
+140.0 Tsnd.
700.0%
1 Jan 2004 Jahr
170.0 Tsnd.
+10.0 Tsnd.
6.25%
1 Jan 2005 Jahr
150.0 Tsnd.
-20.0 Tsnd.
-11.76%
1 Jan 2006 Jahr
110.0 Tsnd.
-40.0 Tsnd.
-26.67%
1 Jan 2007 Jahr
50.0 Tsnd.
-60.0 Tsnd.
-54.55%
1 Jan 2008 Jahr
210.0 Tsnd.
+160.0 Tsnd.
320.0%
1 Jan 2009 Jahr
280.0 Tsnd.
+70.0 Tsnd.
33.33%
1 Jan 2010 Jahr
60.0 Tsnd.
-220.0 Tsnd.
-78.57%
1 Jan 2011 Jahr
50.0 Tsnd.
-10.0 Tsnd.
-16.67%
1 Jan 2012 Jahr
20.0 Tsnd.
-30.0 Tsnd.
-60.0%
1 Jan 2015 Jahr
30.0 Tsnd.
+10.0 Tsnd.
50.0%
Bewertung der Länder gemäß mit laufender Statistik nach Jahren


Kommentare: