30
/de/
AIzaSyAYiBZKx7MnpbEhh9jyipgxe19OcubqV5w
April 1, 2024
116055
Cuba
CUB
true
2
1
Net bilateral aid flows from DAC donors, Denmark (current US$)
2011,2010,2009,2008,2007,2002,2000,1999,1982,1981,1980,1979,1977,1974,1972
Download
Bibliothek der Globalstatistik →Cuba →

Net bilateral aid flows from DAC donors, Denmark (current US$)

Diese Statistik in anderen Ländern:

AfghanistanAlbaniaAlgeriaAngolaArab WorldArgentinaArmeniaAzerbaijanBahrainBangladeshBelarusBelizeBeninBhutanBoliviaBosnia and HerzegovinaBotswanaBrazilBulgariaBurkina FasoBurundiCabo VerdeCambodiaCameroonCaribbean small statesCentral African RepublicCentral Europe and the BalticsChadChileChinaColombiaComorosCongo, Dem. Rep.Congo, Rep.Costa RicaCote d'IvoireCroatiaCubaCyprusCzech RepublicDjiboutiDominicaDominican RepublicEast Asia & PacificEast Asia & Pacific (excluding high income)East Asia & Pacific (IDA & IBRD countries)EcuadorEgypt, Arab Rep.El SalvadorEritreaEstoniaEthiopiaEuro areaEurope & Central AsiaEurope & Central Asia (excluding high income)Europe & Central Asia (IDA & IBRD countries)European UnionFijiFragile and conflict affected situationsGambia, TheGeorgiaGhanaGrenadaGuatemalaGuineaGuinea-BissauGuyanaHaitiHeavily indebted poor countries (HIPC)High incomeHondurasHungaryIBRD onlyIDA & IBRD totalIDA blendIDA onlyIDA totalIndiaIndonesiaIran, Islamic Rep.IraqIsraelJamaicaJordanKazakhstanKenyaKorea, Dem. People’s Rep.Korea, Rep.KosovoKuwaitKyrgyz RepublicLao PDRLatin America & Caribbean Latin America & Caribbean (excluding high income)Latin America & the Caribbean (IDA & IBRD countries)LatviaLeast developed countries: UN classificationLebanonLesothoLiberiaLibyaLithuaniaLow & middle incomeLow incomeLower middle incomeMacedonia, FYRMadagascarMalawiMalaysiaMaldivesMaliMaltaMauritaniaMauritiusMexicoMiddle East & North AfricaMiddle East & North Africa (excluding high income)Middle East & North Africa (IDA & IBRD countries)Middle incomeMoldovaMongoliaMontenegroMoroccoMozambiqueMyanmarNamibiaNepalNicaraguaNigerNigeriaOECD membersOmanOther small statesPacific island small statesPakistanPanamaPapua New GuineaParaguayPeruPhilippinesPolandRomaniaRussian FederationRwandaSamoaSenegalSerbiaSeychellesSierra LeoneSingaporeSlovak RepublicSloveniaSmall statesSolomon IslandsSomaliaSouth AfricaSouth AsiaSouth Asia (IDA & IBRD)South SudanSri LankaSub-Saharan Africa Sub-Saharan Africa (excluding high income)Sub-Saharan Africa (IDA & IBRD countries)SudanSwazilandSyrian Arab RepublicTajikistanTanzaniaThailandTimor-LesteTogoTongaTrinidad and TobagoTunisiaTurkeyTurkmenistanUgandaUkraineUpper middle incomeUruguayUzbekistanVanuatuVenezuela, RBVietnamWest Bank and GazaWorldYemen, Rep.ZambiaZimbabwe

Zeitlinie:

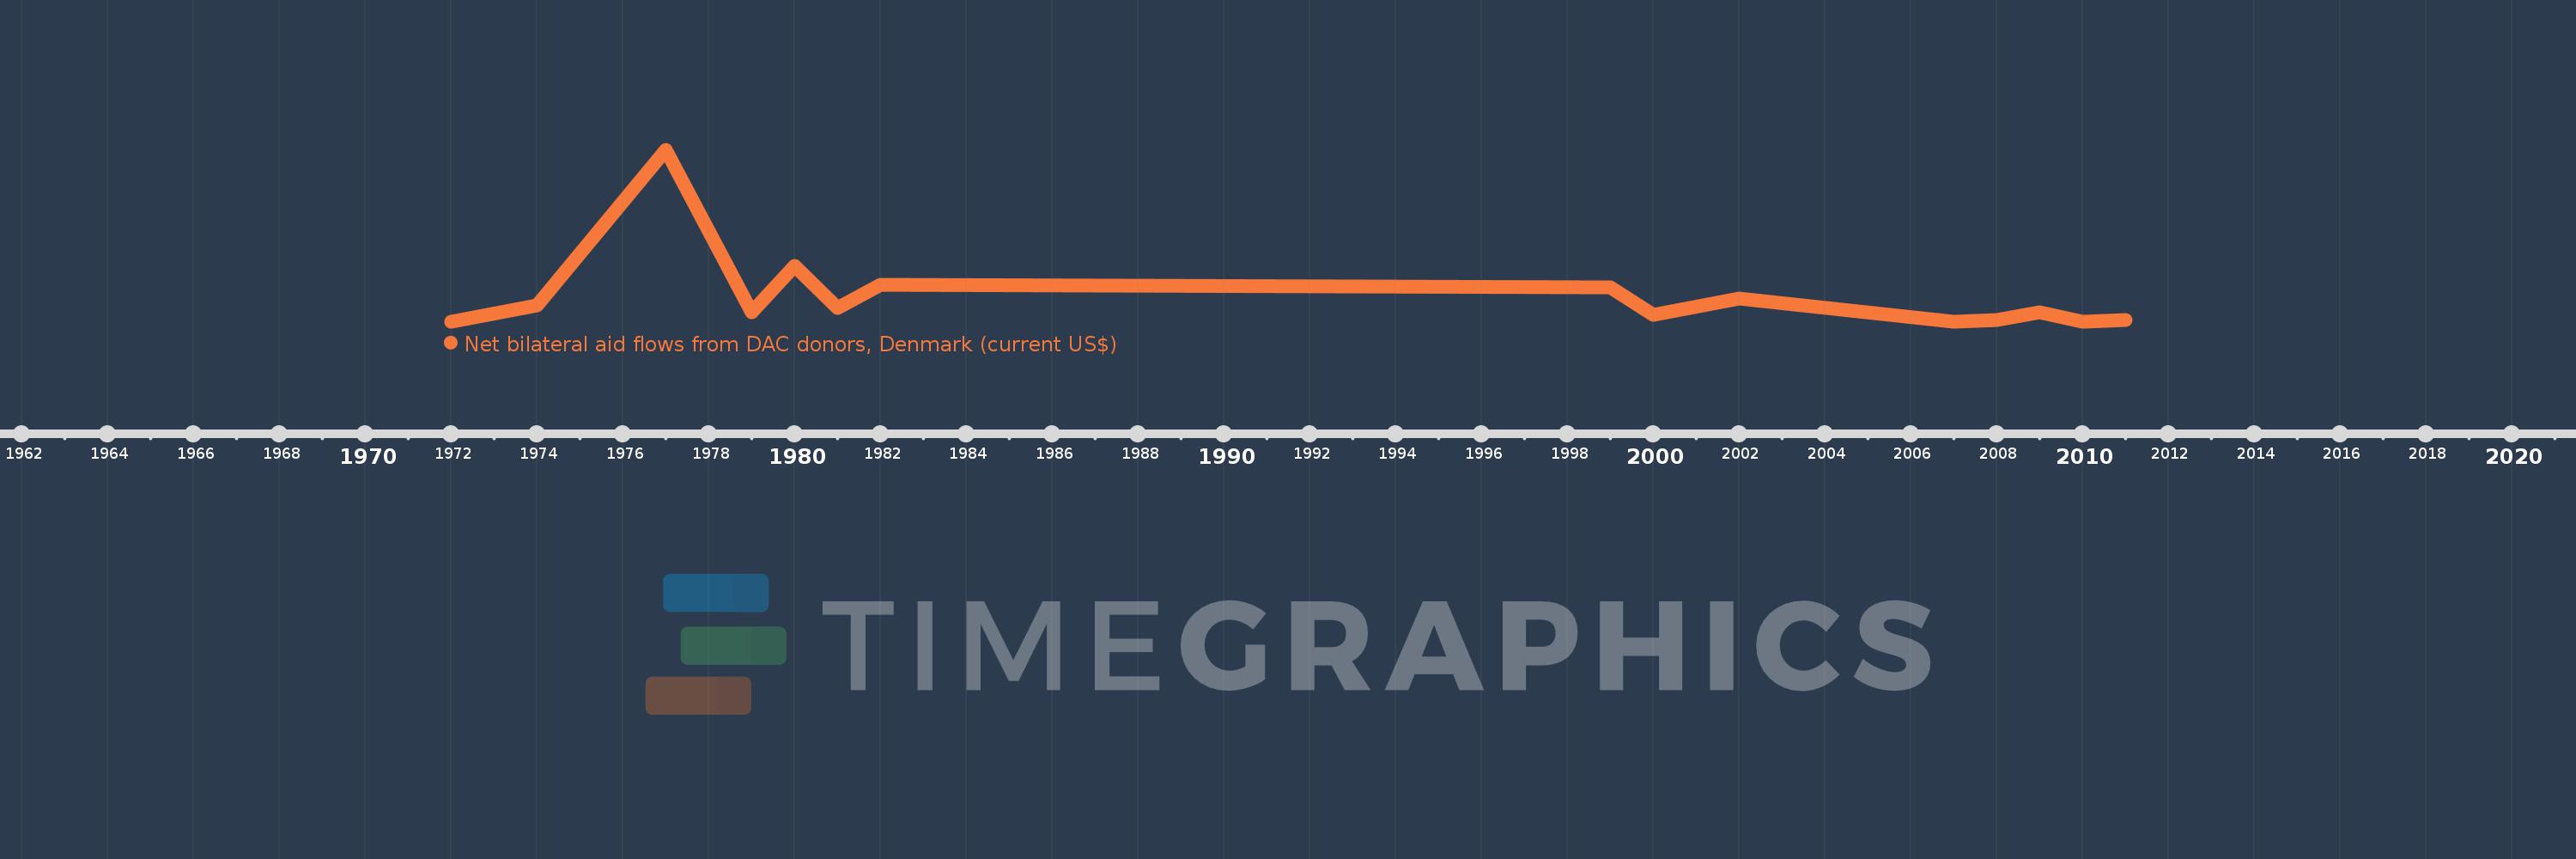
Diese Zeitleiste vorliegt die Graphik ab 1972 J. bis 2011 J. Cuba. Die Angaben bis 1971 J. sind nicht vorhanden. Die Zahl aktueller Beobachtungen nach Daten: 15.

Die Quelle (Bezeichnung):

Kennzahlen der Weltentwicklung

Die Quelle (Einrichtung):

Development Assistance Committee of the Organisation for Economic Co-operation and Development, Geographical Distribution of Financial Flows to Developing Countries, Development Co-operation Report, and International Development Statistics database. Data are available online at: www.oecd.org/dac/stats/idsonline.

Kategorien:

Aid Effectiveness

Es wurde aktualisiert:

23 Apr 2017 Jahr

Kennzahlen der Wertänderungen vom Jahr zum Jahr

im Durchschnitt:
120.0 Tsnd.
Minimum:
10.0 Tsnd.
1 Jan 1972 Jahr
Maximum:
750.0 Tsnd.
1 Jan 1977 Jahr
Zum Datum der Beobachtung
Wert
Absolute Veränderung
Die Veränderung bezüglich dem vorherigen Wert
1 Jan 1972 Jahr
10.0 Tsnd.
+10.0 Tsnd.
0.0%
1 Jan 1974 Jahr
80.0 Tsnd.
+70.0 Tsnd.
700.0%
1 Jan 1977 Jahr
750.0 Tsnd.
+670.0 Tsnd.
837.5%
1 Jan 1979 Jahr
50.0 Tsnd.
-700.0 Tsnd.
-93.33%
1 Jan 1980 Jahr
250.0 Tsnd.
+200.0 Tsnd.
400.0%
1 Jan 1981 Jahr
70.0 Tsnd.
-180.0 Tsnd.
-72.0%
1 Jan 1982 Jahr
170.0 Tsnd.
+100.0 Tsnd.
142.86%
1 Jan 1999 Jahr
160.0 Tsnd.
-10.0 Tsnd.
-5.88%
1 Jan 2000 Jahr
40.0 Tsnd.
-120.0 Tsnd.
-75.0%
1 Jan 2002 Jahr
110.0 Tsnd.
+70.0 Tsnd.
175.0%
1 Jan 2007 Jahr
10.0 Tsnd.
-100.0 Tsnd.
-90.91%
1 Jan 2008 Jahr
20.0 Tsnd.
+10.0 Tsnd.
100.0%
1 Jan 2009 Jahr
50.0 Tsnd.
+30.0 Tsnd.
150.0%
1 Jan 2010 Jahr
10.0 Tsnd.
-40.0 Tsnd.
-80.0%
1 Jan 2011 Jahr
20.0 Tsnd.
+10.0 Tsnd.
100.0%

Bewertung der Länder gemäß mit laufender Statistik nach Jahren