29
/de/
de
AIzaSyAYiBZKx7MnpbEhh9jyipgxe19OcubqV5w
April 1, 2024
113127
Costa Rica
CRI
true
2
1
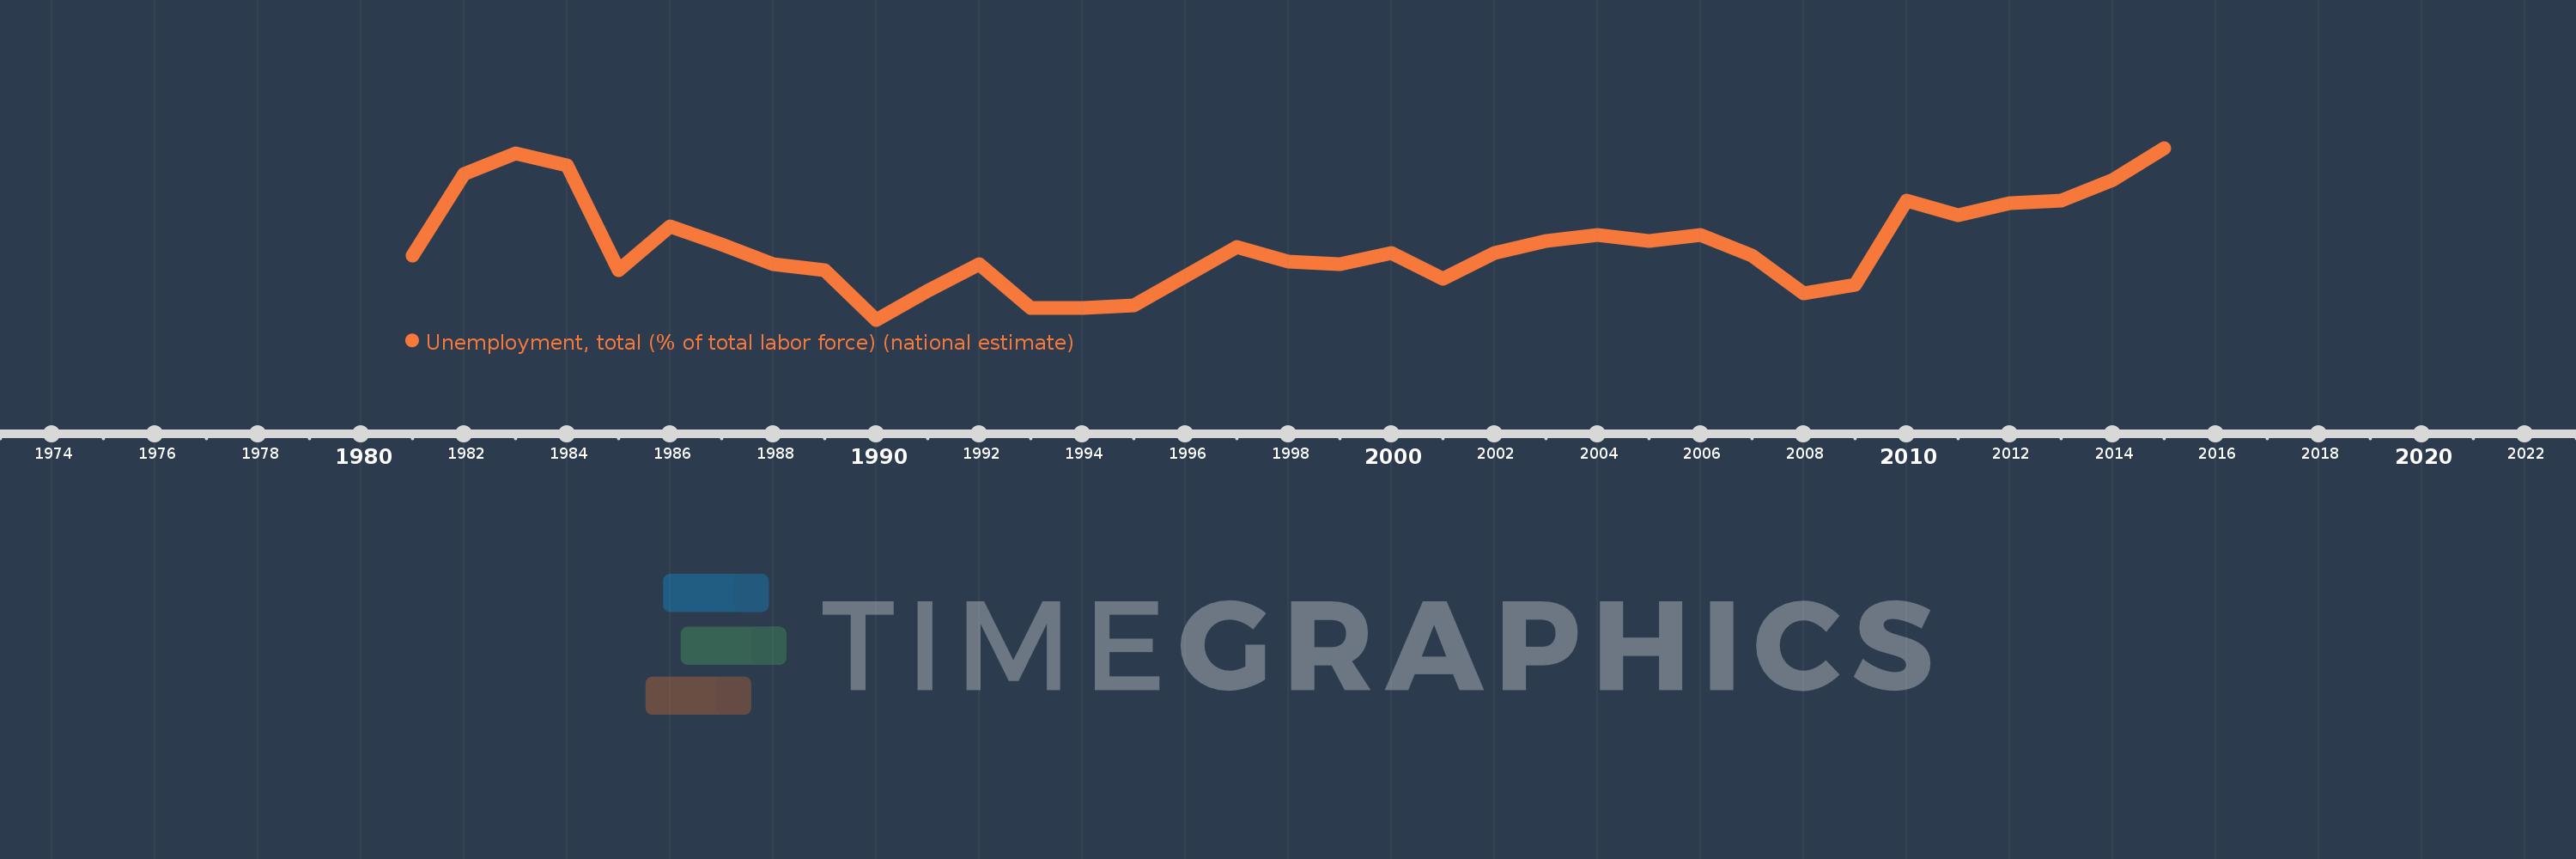
Unemployment, total (% of total labor force) (national estimate)
2015,2014,2013,2012,2011,2010,2009,2008,2007,2006,2005,2004,2003,2002,2001,2000,1999,1998,1997,1996,1995,1994,1993,1992,1991,1990,1989,1988,1987,1986,1985,1984,1983,1982,1981
Diese Statistik in anderen Ländern:
AfghanistanAlbaniaAlgeriaAmerican SamoaAntigua and BarbudaArab WorldArgentinaArmeniaArubaAustraliaAustriaAzerbaijanBahamas, TheBahrainBangladeshBarbadosBelarusBelgiumBelizeBeninBermudaBhutanBoliviaBosnia and HerzegovinaBotswanaBrazilBritish Virgin IslandsBrunei DarussalamBulgariaBurkina FasoBurundiCabo VerdeCambodiaCameroonCanadaCaribbean small statesCayman IslandsCentral Europe and the BalticsChadChileChinaColombiaComorosCongo, Dem. Rep.Costa RicaCote d'IvoireCroatiaCubaCyprusCzech RepublicDenmarkDjiboutiDominicaDominican RepublicEarly-demographic dividendEast Asia & PacificEast Asia & Pacific (excluding high income)East Asia & Pacific (IDA & IBRD countries)EcuadorEgypt, Arab Rep.El SalvadorEquatorial GuineaEstoniaEthiopiaEuro areaEurope & Central AsiaEurope & Central Asia (excluding high income)Europe & Central Asia (IDA & IBRD countries)European UnionFaroe IslandsFijiFinlandFranceFrench PolynesiaGabonGambia, TheGeorgiaGermanyGhanaGibraltarGreeceGreenlandGrenadaGuamGuatemalaGuineaGuyanaHaitiHigh incomeHondurasHong Kong SAR, ChinaHungaryIBRD onlyIcelandIDA & IBRD totalIDA blendIndiaIndonesiaIran, Islamic Rep.IraqIrelandIsle of ManIsraelItalyJamaicaJapanJordanKazakhstanKenyaKiribatiKorea, Rep.KosovoKuwaitKyrgyz RepublicLao PDRLate-demographic dividendLatin America & Caribbean Latin America & Caribbean (excluding high income)Latin America & the Caribbean (IDA & IBRD countries)LatviaLebanonLesothoLiberiaLibyaLiechtensteinLithuaniaLow & middle incomeLower middle incomeLuxembourgMacao SAR, ChinaMacedonia, FYRMadagascarMalawiMalaysiaMaldivesMaliMaltaMarshall IslandsMauritaniaMauritiusMexicoMiddle East & North AfricaMiddle East & North Africa (excluding high income)Middle East & North Africa (IDA & IBRD countries)Middle incomeMoldovaMonacoMongoliaMontenegroMoroccoMozambiqueMyanmarNamibiaNauruNepalNetherlandsNew CaledoniaNew ZealandNicaraguaNigerNigeriaNorth AmericaNorthern Mariana IslandsNorwayOECD membersPakistanPalauPanamaPapua New GuineaParaguayPeruPhilippinesPolandPortugalPost-demographic dividendPuerto RicoQatarRomaniaRussian FederationRwandaSamoaSan MarinoSao Tome and PrincipeSaudi ArabiaSenegalSerbiaSeychellesSierra LeoneSingaporeSlovak RepublicSloveniaSolomon IslandsSouth AfricaSouth AsiaSouth Asia (IDA & IBRD)South SudanSpainSri LankaSt. Kitts and NevisSt. LuciaSt. Vincent and the GrenadinesSudanSurinameSwazilandSwedenSwitzerlandSyrian Arab RepublicTajikistanTanzaniaThailandTimor-LesteTongaTrinidad and TobagoTunisiaTurkeyTurks and Caicos IslandsTuvaluUgandaUkraineUnited Arab EmiratesUnited KingdomUnited StatesUpper middle incomeUruguayVanuatuVenezuela, RBVietnamWest Bank and GazaWorldYemen, Rep.ZambiaZimbabwe Zeitlinie:
Diese Zeitleiste vorliegt die Graphik ab 1981 J. bis 2015 J. Costa Rica. Die Angaben bis 1980 J. sind nicht vorhanden. Die Zahl aktueller Beobachtungen nach Daten: 35.
Die Quelle (Bezeichnung):
Kennzahlen der Weltentwicklung
Die Quelle (Einrichtung):
International Labour Organization, Key Indicators of the Labour Market database.
Kategorien:
Social Protection & Labor
Es wurde aktualisiert:
23 Apr 2017 Jahr
Kennzahlen der Wertänderungen vom Jahr zum Jahr
Minimum:
3.7
1 Jan 1990 Jahr
Maximum:
9.6
1 Jan 2015 Jahr
Zum Datum der Beobachtung
Wert
Absolute Veränderung
Die Veränderung bezüglich dem vorherigen Wert
1 Jan 1981 Jahr
5.9
+5.9
0.0%
1 Jan 1982 Jahr
8.7
+2.8
47.46%
1 Jan 1983 Jahr
9.4
+0.7
8.05%
1 Jan 1984 Jahr
9.0
-0.4
-4.26%
1 Jan 1985 Jahr
5.4
-3.6
-40.0%
1 Jan 1986 Jahr
6.9
+1.5
27.78%
1 Jan 1987 Jahr
6.3
-0.6
-8.7%
1 Jan 1988 Jahr
5.6
-0.7
-11.11%
1 Jan 1989 Jahr
5.4
-0.2
-3.57%
1 Jan 1990 Jahr
3.7
-1.7
-31.48%
1 Jan 1991 Jahr
4.7
+1.0
27.03%
1 Jan 1992 Jahr
5.6
+0.9
19.15%
1 Jan 1993 Jahr
4.1
-1.5
-26.79%
1 Jan 1994 Jahr
4.1
0.0
0.0%
1 Jan 1995 Jahr
4.2
+0.1
2.44%
1 Jan 1996 Jahr
5.2
+1.0
23.81%
1 Jan 1997 Jahr
6.2
+1.0
19.23%
1 Jan 1998 Jahr
5.7
-0.5
-8.06%
1 Jan 1999 Jahr
5.6
-0.1
-1.75%
1 Jan 2000 Jahr
6.0
+0.4
7.14%
1 Jan 2001 Jahr
5.1
-0.9
-15.0%
1 Jan 2002 Jahr
6.0
+0.9
17.65%
1 Jan 2003 Jahr
6.4
+0.4
6.67%
1 Jan 2004 Jahr
6.6
+0.2
3.12%
1 Jan 2005 Jahr
6.4
-0.2
-3.03%
1 Jan 2006 Jahr
6.6
+0.2
3.12%
1 Jan 2007 Jahr
5.9
-0.7
-10.61%
1 Jan 2008 Jahr
4.6
-1.3
-22.03%
1 Jan 2009 Jahr
4.9
+0.3
6.52%
1 Jan 2010 Jahr
7.8
+2.9
59.18%
1 Jan 2011 Jahr
7.3
-0.5
-6.41%
1 Jan 2012 Jahr
7.7
+0.4
5.48%
1 Jan 2013 Jahr
7.8
+0.1
1.3%
1 Jan 2014 Jahr
8.5
+0.7
8.97%
1 Jan 2015 Jahr
9.6
+1.1
12.94%
Bewertung der Länder gemäß mit laufender Statistik nach Jahren


Kommentare: