29
/de/
de
AIzaSyAYiBZKx7MnpbEhh9jyipgxe19OcubqV5w
April 1, 2024
108115
Colombia
COL
true
2
1
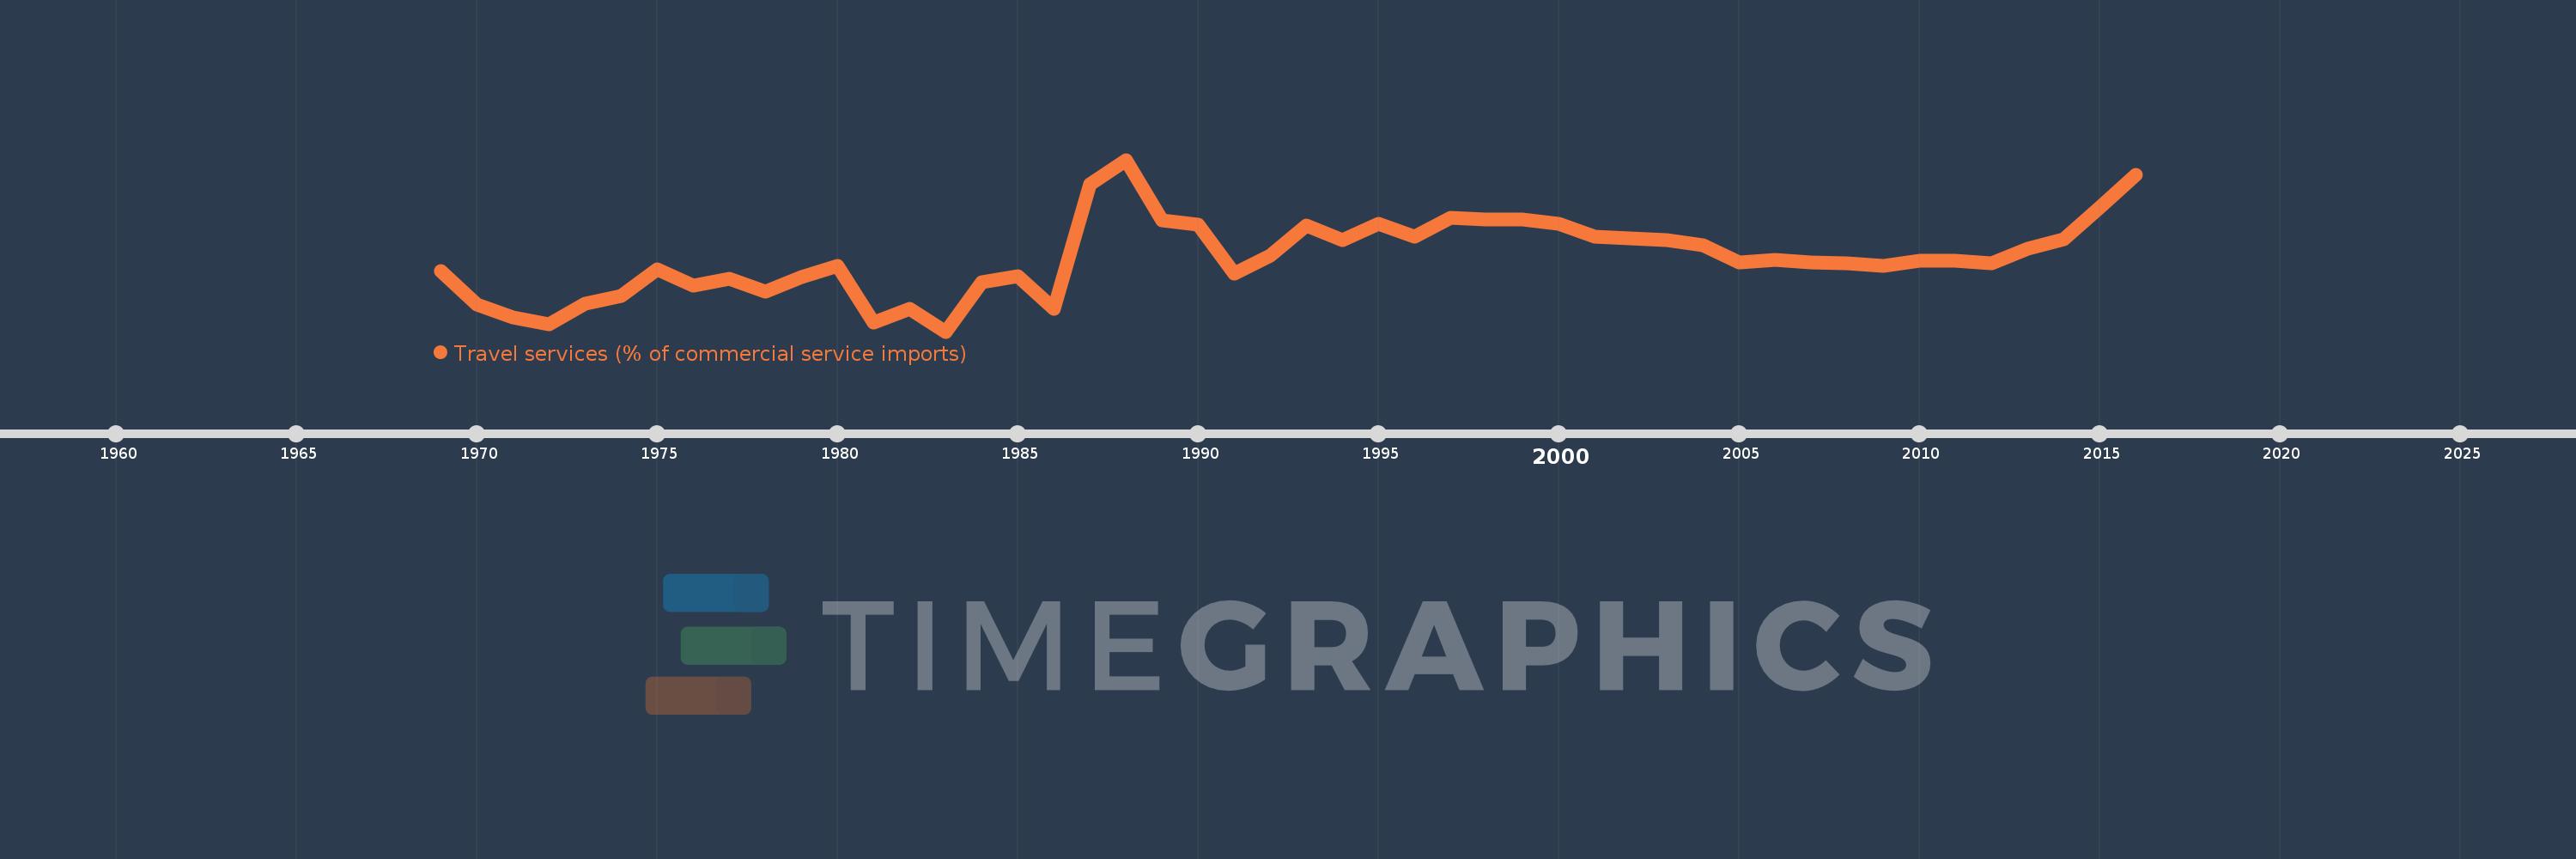
Travel services (% of commercial service imports)
2016,2015,2014,2013,2012,2011,2010,2009,2008,2007,2006,2005,2004,2003,2002,2001,2000,1999,1998,1997,1996,1995,1994,1993,1992,1991,1990,1989,1988,1987,1986,1985,1984,1983,1982,1981,1980,1979,1978,1977,1976,1975,1974,1973,1972,1971,1970,1969
Diese Statistik in anderen Ländern:
AfghanistanAlbaniaAlgeriaAngolaAntigua and BarbudaArab WorldArgentinaArmeniaArubaAustraliaAustriaAzerbaijanBahamas, TheBahrainBangladeshBarbadosBelarusBelgiumBelizeBeninBermudaBhutanBoliviaBosnia and HerzegovinaBotswanaBrazilBrunei DarussalamBulgariaBurkina FasoBurundiCabo VerdeCambodiaCameroonCanadaCaribbean small statesCentral African RepublicCentral Europe and the BalticsChadChileChinaColombiaComorosCongo, Dem. Rep.Congo, Rep.Costa RicaCote d'IvoireCroatiaCuracaoCyprusCzech RepublicDenmarkDjiboutiDominicaDominican RepublicEarly-demographic dividendEast Asia & PacificEast Asia & Pacific (excluding high income)East Asia & Pacific (IDA & IBRD countries)EcuadorEgypt, Arab Rep.El SalvadorEritreaEstoniaEthiopiaEuro areaEurope & Central AsiaEurope & Central Asia (excluding high income)Europe & Central Asia (IDA & IBRD countries)European UnionFaroe IslandsFijiFinlandFragile and conflict affected situationsFranceFrench PolynesiaGabonGambia, TheGeorgiaGermanyGhanaGreeceGrenadaGuatemalaGuineaGuinea-BissauGuyanaHaitiHeavily indebted poor countries (HIPC)High incomeHondurasHong Kong SAR, ChinaHungaryIBRD onlyIcelandIDA & IBRD totalIDA onlyIDA totalIndiaIndonesiaIran, Islamic Rep.IraqIrelandIsraelItalyJamaicaJapanJordanKazakhstanKenyaKiribatiKorea, Rep.KosovoKuwaitKyrgyz RepublicLao PDRLate-demographic dividendLatin America & Caribbean Latin America & Caribbean (excluding high income)Latin America & the Caribbean (IDA & IBRD countries)LatviaLeast developed countries: UN classificationLebanonLesothoLiberiaLibyaLithuaniaLow & middle incomeLow incomeLower middle incomeLuxembourgMacao SAR, ChinaMacedonia, FYRMadagascarMalawiMalaysiaMaldivesMaliMaltaMarshall IslandsMauritaniaMauritiusMexicoMicronesia, Fed. Sts.Middle East & North AfricaMiddle East & North Africa (excluding high income)Middle East & North Africa (IDA & IBRD countries)Middle incomeMoldovaMongoliaMontenegroMoroccoMozambiqueMyanmarNamibiaNepalNetherlandsNew CaledoniaNew ZealandNicaraguaNigerNigeriaNorth AmericaNorwayOECD membersOmanOther small statesPacific island small statesPakistanPalauPanamaPapua New GuineaParaguayPeruPhilippinesPolandPortugalPost-demographic dividendPre-demographic dividendQatarRomaniaRussian FederationRwandaSamoaSao Tome and PrincipeSaudi ArabiaSenegalSerbiaSeychellesSierra LeoneSingaporeSint Maarten (Dutch part)Slovak RepublicSloveniaSmall statesSolomon IslandsSouth AfricaSouth AsiaSouth Asia (IDA & IBRD)South SudanSpainSri LankaSt. Kitts and NevisSt. LuciaSt. Vincent and the GrenadinesSub-Saharan Africa Sub-Saharan Africa (excluding high income)Sub-Saharan Africa (IDA & IBRD countries)SudanSurinameSwazilandSwedenSwitzerlandSyrian Arab RepublicTajikistanTanzaniaThailandTimor-LesteTogoTongaTrinidad and TobagoTunisiaTurkeyTuvaluUgandaUkraineUnited KingdomUnited StatesUpper middle incomeUruguayVanuatuVenezuela, RBWest Bank and GazaWorldYemen, Rep.ZambiaZimbabwe Zeitlinie:
Diese Zeitleiste vorliegt die Graphik ab 1969 J. bis 2016 J. Colombia. Die Angaben bis 1968 J. sind nicht vorhanden. Die Zahl aktueller Beobachtungen nach Daten: 48.
Die Quelle (Bezeichnung):
Kennzahlen der Weltentwicklung
Die Quelle (Einrichtung):
International Monetary Fund, Balance of Payments Statistics Yearbook and data files.
Kategorien:
Private Sector, Trade
Es wurde aktualisiert:
23 Apr 2017 Jahr
Kennzahlen der Wertänderungen vom Jahr zum Jahr
Minimum:
20.061
1 Jan 1983 Jahr
Maximum:
40.462
1 Jan 1988 Jahr
Zum Datum der Beobachtung
Wert
Absolute Veränderung
Die Veränderung bezüglich dem vorherigen Wert
1 Jan 1969 Jahr
27.273
+27.273
0.0%
1 Jan 1970 Jahr
23.228
-4.044
-14.83%
1 Jan 1971 Jahr
21.782
-1.446
-6.23%
1 Jan 1972 Jahr
20.93
-0.852
-3.91%
1 Jan 1973 Jahr
23.344
+2.414
11.53%
1 Jan 1974 Jahr
24.269
+0.925
3.96%
1 Jan 1975 Jahr
27.477
+3.208
13.22%
1 Jan 1976 Jahr
25.562
-1.916
-6.97%
1 Jan 1977 Jahr
26.285
+0.723
2.83%
1 Jan 1978 Jahr
24.756
-1.528
-5.81%
1 Jan 1979 Jahr
26.524
+1.767
7.14%
1 Jan 1980 Jahr
27.901
+1.378
5.2%
1 Jan 1981 Jahr
21.155
-6.746
-24.18%
1 Jan 1982 Jahr
22.733
+1.578
7.46%
1 Jan 1983 Jahr
20.061
-2.673
-11.76%
1 Jan 1984 Jahr
25.947
+5.886
29.34%
1 Jan 1985 Jahr
26.618
+0.671
2.59%
1 Jan 1986 Jahr
22.764
-3.854
-14.48%
1 Jan 1987 Jahr
37.6
+14.836
65.18%
1 Jan 1988 Jahr
40.462
+2.862
7.61%
1 Jan 1989 Jahr
33.313
-7.149
-17.67%
1 Jan 1990 Jahr
32.715
-0.597
-1.79%
1 Jan 1991 Jahr
26.976
-5.74
-17.54%
1 Jan 1992 Jahr
29.086
+2.11
7.82%
1 Jan 1993 Jahr
32.7
+3.615
12.43%
1 Jan 1994 Jahr
30.894
-1.806
-5.52%
1 Jan 1995 Jahr
32.868
+1.974
6.39%
1 Jan 1996 Jahr
31.359
-1.509
-4.59%
1 Jan 1997 Jahr
33.604
+2.245
7.16%
1 Jan 1998 Jahr
33.344
-0.26
-0.77%
1 Jan 1999 Jahr
33.419
+0.076
0.23%
1 Jan 2000 Jahr
32.88
-0.54
-1.61%
1 Jan 2001 Jahr
31.348
-1.531
-4.66%
1 Jan 2002 Jahr
31.162
-0.186
-0.59%
1 Jan 2003 Jahr
30.878
-0.284
-0.91%
1 Jan 2004 Jahr
30.348
-0.53
-1.72%
1 Jan 2005 Jahr
28.299
-2.05
-6.75%
1 Jan 2006 Jahr
28.531
+0.233
0.82%
1 Jan 2007 Jahr
28.289
-0.242
-0.85%
1 Jan 2008 Jahr
28.208
-0.081
-0.29%
1 Jan 2009 Jahr
27.828
-0.38
-1.35%
1 Jan 2010 Jahr
28.441
+0.613
2.2%
1 Jan 2011 Jahr
28.474
+0.033
0.12%
1 Jan 2012 Jahr
28.206
-0.267
-0.94%
1 Jan 2013 Jahr
29.929
+1.723
6.11%
1 Jan 2014 Jahr
31.048
+1.118
3.74%
1 Jan 2015 Jahr
34.831
+3.783
12.18%
1 Jan 2016 Jahr
38.664
+3.833
11.0%
Bewertung der Länder gemäß mit laufender Statistik nach Jahren


Kommentare: