29
/de/
de
AIzaSyAYiBZKx7MnpbEhh9jyipgxe19OcubqV5w
April 1, 2024
107236
Colombia
COL
true
2
1
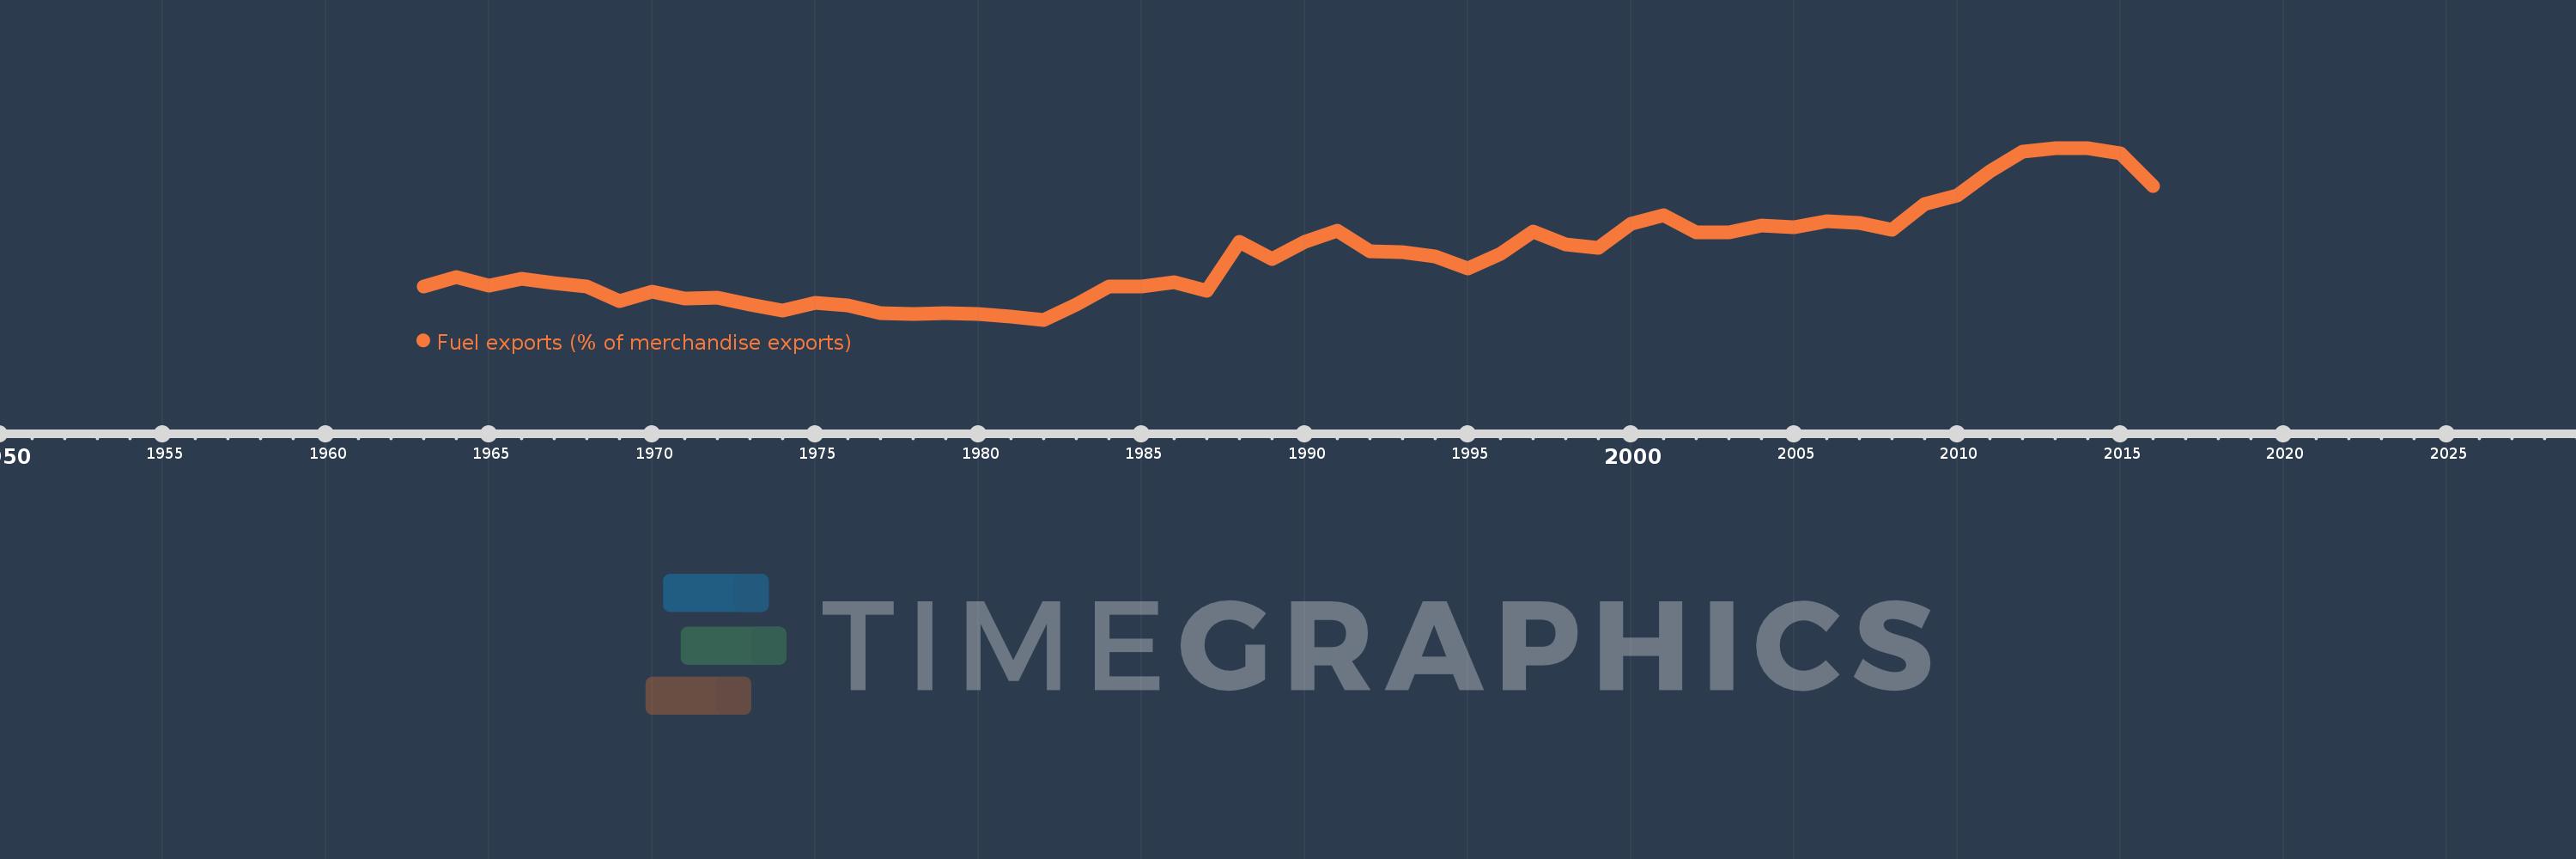
Fuel exports (% of merchandise exports)
2016,2015,2014,2013,2012,2011,2010,2009,2008,2007,2006,2005,2004,2003,2002,2001,2000,1999,1998,1997,1996,1995,1994,1993,1992,1991,1990,1989,1988,1987,1986,1985,1984,1983,1982,1981,1980,1979,1978,1977,1976,1975,1974,1973,1972,1971,1970,1969,1968,1967,1966,1965,1964,1963
Diese Statistik in anderen Ländern:
AfghanistanAlbaniaAlgeriaAndorraAngolaAntigua and BarbudaArab WorldArgentinaArmeniaArubaAustraliaAustriaAzerbaijanBahamas, TheBahrainBangladeshBarbadosBelarusBelgiumBelizeBeninBermudaBhutanBoliviaBosnia and HerzegovinaBotswanaBrazilBrunei DarussalamBulgariaBurkina FasoBurundiCabo VerdeCambodiaCameroonCanadaCaribbean small statesCayman IslandsCentral African RepublicCentral Europe and the BalticsChadChileChinaColombiaComorosCongo, Dem. Rep.Congo, Rep.Costa RicaCote d'IvoireCroatiaCubaCyprusCzech RepublicDenmarkDjiboutiDominicaDominican RepublicEarly-demographic dividendEast Asia & PacificEast Asia & Pacific (excluding high income)East Asia & Pacific (IDA & IBRD countries)EcuadorEgypt, Arab Rep.El SalvadorEquatorial GuineaEritreaEstoniaEthiopiaEuro areaEurope & Central AsiaEurope & Central Asia (excluding high income)Europe & Central Asia (IDA & IBRD countries)European UnionFaroe IslandsFijiFinlandFragile and conflict affected situationsFranceFrench PolynesiaGabonGambia, TheGeorgiaGermanyGhanaGreeceGreenlandGrenadaGuatemalaGuineaGuinea-BissauGuyanaHaitiHeavily indebted poor countries (HIPC)High incomeHondurasHong Kong SAR, ChinaHungaryIBRD onlyIcelandIDA & IBRD totalIDA blendIDA onlyIDA totalIndiaIndonesiaIran, Islamic Rep.IraqIrelandIsraelItalyJamaicaJapanJordanKazakhstanKenyaKiribatiKorea, Rep.KuwaitKyrgyz RepublicLao PDRLate-demographic dividendLatin America & Caribbean Latin America & Caribbean (excluding high income)Latin America & the Caribbean (IDA & IBRD countries)LatviaLeast developed countries: UN classificationLebanonLesothoLiberiaLibyaLithuaniaLow & middle incomeLower middle incomeLuxembourgMacao SAR, ChinaMacedonia, FYRMadagascarMalawiMalaysiaMaldivesMaliMaltaMauritaniaMauritiusMexicoMiddle East & North AfricaMiddle East & North Africa (excluding high income)Middle East & North Africa (IDA & IBRD countries)Middle incomeMoldovaMongoliaMoroccoMozambiqueMyanmarNamibiaNepalNetherlandsNew CaledoniaNew ZealandNicaraguaNigerNigeriaNorth AmericaNorwayOECD membersOmanOther small statesPacific island small statesPakistanPalauPanamaPapua New GuineaParaguayPeruPhilippinesPolandPortugalPost-demographic dividendPre-demographic dividendQatarRomaniaRussian FederationRwandaSamoaSao Tome and PrincipeSaudi ArabiaSenegalSerbiaSeychellesSierra LeoneSingaporeSlovak RepublicSloveniaSmall statesSolomon IslandsSomaliaSouth AfricaSouth AsiaSouth Asia (IDA & IBRD)SpainSri LankaSt. Kitts and NevisSt. LuciaSt. Vincent and the GrenadinesSub-Saharan Africa Sub-Saharan Africa (excluding high income)Sub-Saharan Africa (IDA & IBRD countries)SudanSurinameSwazilandSwedenSwitzerlandSyrian Arab RepublicTajikistanTanzaniaThailandTimor-LesteTogoTongaTrinidad and TobagoTunisiaTurkeyTurkmenistanTurks and Caicos IslandsTuvaluUgandaUkraineUnited Arab EmiratesUnited KingdomUnited StatesUpper middle incomeUruguayVanuatuVenezuela, RBVietnamVirgin Islands (U.S.)WorldYemen, Rep.ZambiaZimbabwe Zeitlinie:
Diese Zeitleiste vorliegt die Graphik ab 1963 J. bis 2016 J. Colombia. Die Angaben bis 1962 J. sind nicht vorhanden. Die Zahl aktueller Beobachtungen nach Daten: 54.
Die Quelle (Bezeichnung):
Kennzahlen der Weltentwicklung
Die Quelle (Einrichtung):
World Bank staff estimates from the Comtrade database maintained by the United Nations Statistics Division.
Kategorien:
Energy & Mining, Private Sector, Trade
Es wurde aktualisiert:
23 Apr 2017 Jahr
Kennzahlen der Wertänderungen vom Jahr zum Jahr
Minimum:
1.547
1 Jan 1982 Jahr
Maximum:
69.641
1 Jan 2013 Jahr
Zum Datum der Beobachtung
Wert
Absolute Veränderung
Die Veränderung bezüglich dem vorherigen Wert
1 Jan 1963 Jahr
14.657
+14.657
0.0%
1 Jan 1964 Jahr
18.315
+3.659
24.96%
1 Jan 1965 Jahr
15.123
-3.192
-17.43%
1 Jan 1966 Jahr
17.821
+2.698
17.84%
1 Jan 1967 Jahr
16.032
-1.789
-10.04%
1 Jan 1968 Jahr
14.647
-1.385
-8.64%
1 Jan 1969 Jahr
9.093
-5.554
-37.92%
1 Jan 1970 Jahr
12.774
+3.681
40.48%
1 Jan 1971 Jahr
10.058
-2.715
-21.26%
1 Jan 1972 Jahr
10.182
+0.123
1.23%
1 Jan 1973 Jahr
7.565
-2.617
-25.71%
1 Jan 1974 Jahr
5.267
-2.297
-30.37%
1 Jan 1975 Jahr
8.276
+3.008
57.11%
1 Jan 1976 Jahr
7.21
-1.066
-12.88%
1 Jan 1977 Jahr
4.071
-3.139
-43.54%
1 Jan 1978 Jahr
3.923
-0.148
-3.62%
1 Jan 1979 Jahr
4.31
+0.387
9.86%
1 Jan 1980 Jahr
3.993
-0.317
-7.36%
1 Jan 1981 Jahr
2.848
-1.145
-28.67%
1 Jan 1982 Jahr
1.547
-1.301
-45.67%
1 Jan 1983 Jahr
7.448
+5.901
381.37%
1 Jan 1984 Jahr
14.654
+7.206
96.75%
1 Jan 1985 Jahr
14.867
+0.213
1.46%
1 Jan 1986 Jahr
16.281
+1.414
9.51%
1 Jan 1987 Jahr
13.019
-3.262
-20.03%
1 Jan 1988 Jahr
32.525
+19.506
149.82%
1 Jan 1989 Jahr
25.75
-6.775
-20.83%
1 Jan 1990 Jahr
32.375
+6.625
25.73%
1 Jan 1991 Jahr
36.893
+4.518
13.96%
1 Jan 1992 Jahr
28.768
-8.126
-22.02%
1 Jan 1993 Jahr
28.471
-0.297
-1.03%
1 Jan 1994 Jahr
26.503
-1.968
-6.91%
1 Jan 1995 Jahr
21.92
-4.583
-17.29%
1 Jan 1996 Jahr
27.708
+5.788
26.41%
1 Jan 1997 Jahr
36.354
+8.646
31.2%
1 Jan 1998 Jahr
31.348
-5.007
-13.77%
1 Jan 1999 Jahr
30.001
-1.346
-4.3%
1 Jan 2000 Jahr
39.735
+9.734
32.45%
1 Jan 2001 Jahr
43.11
+3.375
8.49%
1 Jan 2002 Jahr
36.334
-6.776
-15.72%
1 Jan 2003 Jahr
36.266
-0.068
-0.19%
1 Jan 2004 Jahr
38.953
+2.687
7.41%
1 Jan 2005 Jahr
38.22
-0.733
-1.88%
1 Jan 2006 Jahr
40.44
+2.22
5.81%
1 Jan 2007 Jahr
39.771
-0.669
-1.65%
1 Jan 2008 Jahr
37.241
-2.53
-6.36%
1 Jan 2009 Jahr
47.257
+10.015
26.89%
1 Jan 2010 Jahr
50.722
+3.465
7.33%
1 Jan 2011 Jahr
60.403
+9.681
19.09%
1 Jan 2012 Jahr
68.201
+7.798
12.91%
1 Jan 2013 Jahr
69.641
+1.44
2.11%
1 Jan 2014 Jahr
69.429
-0.212
-0.3%
1 Jan 2015 Jahr
67.529
-1.901
-2.74%
1 Jan 2016 Jahr
54.449
-13.079
-19.37%
Bewertung der Länder gemäß mit laufender Statistik nach Jahren


Kommentare: