29
/
en
AIzaSyAYiBZKx7MnpbEhh9jyipgxe19OcubqV5w
April 1, 2024
99128
Cambodia
KHM
true
2
1
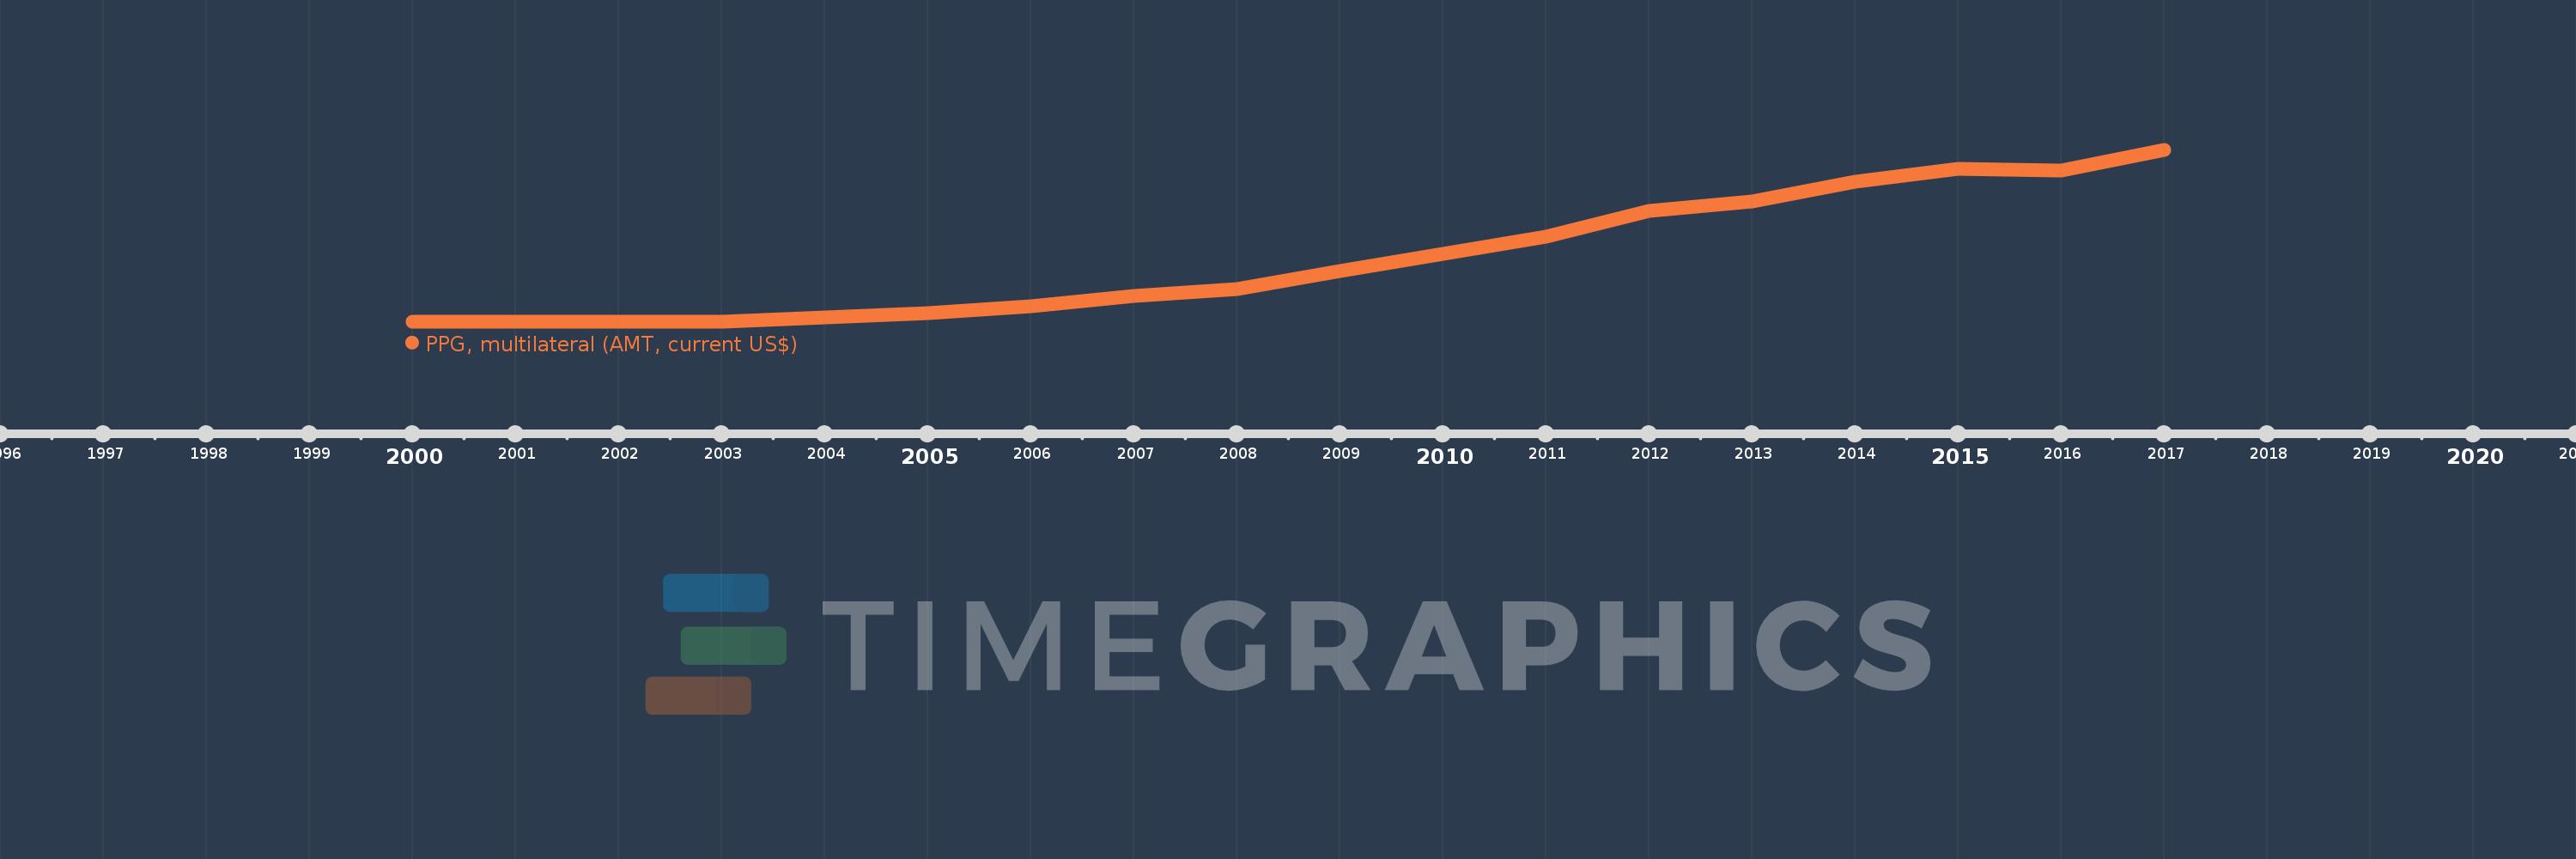
PPG, multilateral (AMT, current US$)
2017,2016,2015,2014,2013,2012,2011,2010,2009,2008,2007,2006,2005,2004,2003,2002,2001,2000
This statistics in other country:
Timeline:
This timeline shows a graph from 2000 to 2017 of Cambodia. No data until 1999. Number of actual observations by date: 18.
Source name:
World Development Indicators
Source organization:
World Bank, International Debt Statistics.
Categories, topics:
External Debt
Last updated:
apr 23, 2017
Indicators value changes by year
Maximum:
58.011 mln
jan 1, 2017
At the date of observation
Value
Absolute change
Change from previous value
jan 1, 2004
1.636 mln
+1.636 mln
%
jan 1, 2005
3.016 mln
+1.38 mln
84.35%
jan 1, 2006
5.413 mln
+2.397 mln
79.48%
jan 1, 2007
8.856 mln
+3.443 mln
63.61%
jan 1, 2008
10.984 mln
+2.128 mln
24.03%
jan 1, 2009
17.26 mln
+6.276 mln
57.14%
jan 1, 2010
23.079 mln
+5.819 mln
33.71%
jan 1, 2011
28.877 mln
+5.798 mln
25.12%
jan 1, 2012
37.374 mln
+8.497 mln
29.42%
jan 1, 2013
40.562 mln
+3.188 mln
8.53%
jan 1, 2014
47.277 mln
+6.715 mln
16.55%
jan 1, 2015
51.623 mln
+4.346 mln
9.19%
jan 1, 2016
51.182 mln
-441.0K
-0.85%
jan 1, 2017
58.011 mln
+6.829 mln
13.34%
Ranking of countries by current statistics by years


Comments: