29
/
en
AIzaSyAYiBZKx7MnpbEhh9jyipgxe19OcubqV5w
April 1, 2024
99098
Cambodia
KHM
true
2
1
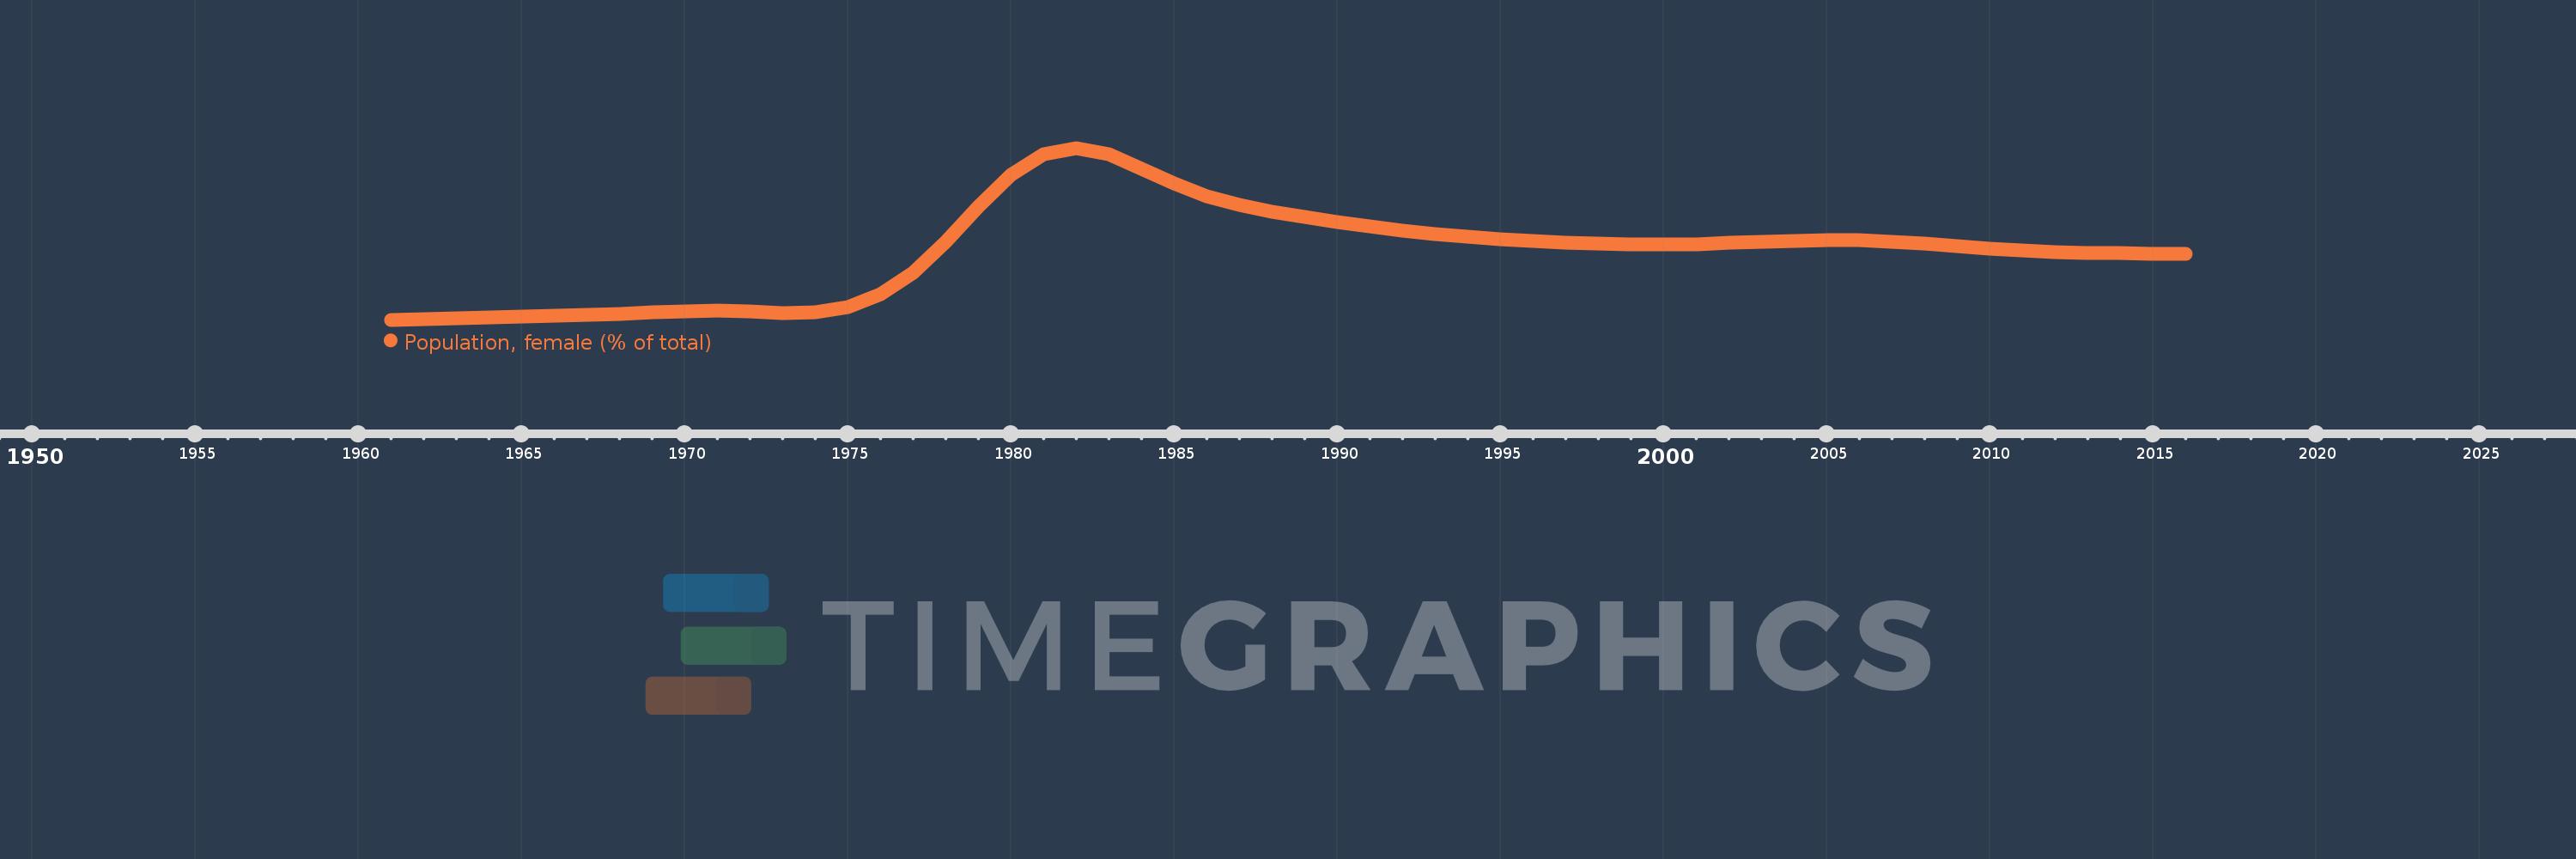
Population, female (% of total)
2016,2015,2014,2013,2012,2011,2010,2009,2008,2007,2006,2005,2004,2003,2002,2001,2000,1999,1998,1997,1996,1995,1994,1993,1992,1991,1990,1989,1988,1987,1986,1985,1984,1983,1982,1981,1980,1979,1978,1977,1976,1975,1974,1973,1972,1971,1970,1969,1968,1967,1966,1965,1964,1963,1962,1961
This statistics in other country:
AfghanistanAlbaniaAlgeriaAngolaAntigua and BarbudaArab WorldArgentinaArmeniaArubaAustraliaAustriaAzerbaijanBahamas, TheBahrainBangladeshBarbadosBelarusBelgiumBelizeBeninBhutanBoliviaBosnia and HerzegovinaBotswanaBrazilBrunei DarussalamBulgariaBurkina FasoBurundiCabo VerdeCambodiaCameroonCanadaCaribbean small statesCentral African RepublicCentral Europe and the BalticsChadChannel IslandsChileChinaColombiaComorosCongo, Dem. Rep.Congo, Rep.Costa RicaCote d'IvoireCroatiaCubaCuracaoCyprusCzech RepublicDenmarkDjiboutiDominican RepublicEarly-demographic dividendEast Asia & PacificEast Asia & Pacific (excluding high income)East Asia & Pacific (IDA & IBRD countries)EcuadorEgypt, Arab Rep.El SalvadorEquatorial GuineaEritreaEstoniaEthiopiaEuro areaEurope & Central AsiaEurope & Central Asia (excluding high income)Europe & Central Asia (IDA & IBRD countries)European UnionFijiFinlandFragile and conflict affected situationsFranceFrench PolynesiaGabonGambia, TheGeorgiaGermanyGhanaGreeceGrenadaGuamGuatemalaGuineaGuinea-BissauGuyanaHaitiHeavily indebted poor countries (HIPC)High incomeHondurasHong Kong SAR, ChinaHungaryIBRD onlyIcelandIDA & IBRD totalIDA blendIDA onlyIDA totalIndiaIndonesiaIran, Islamic Rep.IraqIrelandIsraelItalyJamaicaJapanJordanKazakhstanKenyaKiribatiKorea, Dem. People’s Rep.Korea, Rep.KosovoKuwaitKyrgyz RepublicLao PDRLate-demographic dividendLatin America & Caribbean Latin America & Caribbean (excluding high income)Latin America & the Caribbean (IDA & IBRD countries)LatviaLeast developed countries: UN classificationLebanonLesothoLiberiaLibyaLithuaniaLow & middle incomeLow incomeLower middle incomeLuxembourgMacao SAR, ChinaMacedonia, FYRMadagascarMalawiMalaysiaMaldivesMaliMaltaMauritaniaMauritiusMexicoMicronesia, Fed. Sts.Middle East & North AfricaMiddle East & North Africa (excluding high income)Middle East & North Africa (IDA & IBRD countries)Middle incomeMoldovaMongoliaMontenegroMoroccoMozambiqueMyanmarNamibiaNepalNetherlandsNew CaledoniaNew ZealandNicaraguaNigerNigeriaNorth AmericaNorwayOECD membersOmanOther small statesPacific island small statesPakistanPanamaPapua New GuineaParaguayPeruPhilippinesPolandPortugalPost-demographic dividendPre-demographic dividendPuerto RicoQatarRomaniaRussian FederationRwandaSamoaSao Tome and PrincipeSaudi ArabiaSenegalSerbiaSeychellesSierra LeoneSingaporeSlovak RepublicSloveniaSmall statesSolomon IslandsSomaliaSouth AfricaSouth AsiaSouth Asia (IDA & IBRD)South SudanSpainSri LankaSt. LuciaSt. Vincent and the GrenadinesSub-Saharan Africa Sub-Saharan Africa (excluding high income)Sub-Saharan Africa (IDA & IBRD countries)SudanSurinameSwazilandSwedenSwitzerlandSyrian Arab RepublicTajikistanTanzaniaThailandTimor-LesteTogoTongaTrinidad and TobagoTunisiaTurkeyTurkmenistanUgandaUkraineUnited Arab EmiratesUnited KingdomUnited StatesUpper middle incomeUruguayUzbekistanVanuatuVenezuela, RBVietnamVirgin Islands (U.S.)West Bank and GazaWorldYemen, Rep.ZambiaZimbabwe Timeline:
This timeline shows a graph from 1961 to 2016 of Cambodia. No data until 1960. Number of actual observations by date: 56.
Source name:
World Development Indicators
Source organization:
World Bank staff estimates based on male/female distributions of United Nations Population Division's World Population Prospects.
Categories, topics:
Health
Last updated:
apr 23, 2017
Indicators value changes by year
Minimum:
50.089
jan 1, 1961
Maximum:
53.062
jan 1, 1982
At the date of observation
Value
Absolute change
Change from previous value
jan 1, 1961
50.089
+50.089
0.0%
jan 1, 1962
50.102
+0.012
0.02%
jan 1, 1963
50.116
+0.014
0.03%
jan 1, 1964
50.13
+0.014
0.03%
jan 1, 1965
50.144
+0.014
0.03%
jan 1, 1966
50.156
+0.012
0.02%
jan 1, 1967
50.172
+0.016
0.03%
jan 1, 1968
50.194
+0.022
0.04%
jan 1, 1969
50.217
+0.023
0.05%
jan 1, 1970
50.234
+0.017
0.03%
jan 1, 1971
50.243
+0.01
0.02%
jan 1, 1972
50.232
-0.011
-0.02%
jan 1, 1973
50.209
-0.023
-0.05%
jan 1, 1974
50.217
+0.008
0.02%
jan 1, 1975
50.313
+0.095
0.19%
jan 1, 1976
50.531
+0.218
0.43%
jan 1, 1977
50.907
+0.376
0.74%
jan 1, 1978
51.434
+0.527
1.03%
jan 1, 1979
52.042
+0.608
1.18%
jan 1, 1980
52.592
+0.551
1.06%
jan 1, 1981
52.955
+0.363
0.69%
jan 1, 1982
53.062
+0.107
0.2%
jan 1, 1983
52.952
-0.111
-0.21%
jan 1, 1984
52.707
-0.244
-0.46%
jan 1, 1985
52.443
-0.264
-0.5%
jan 1, 1986
52.228
-0.214
-0.41%
jan 1, 1987
52.073
-0.155
-0.3%
jan 1, 1988
51.954
-0.119
-0.23%
jan 1, 1989
51.863
-0.091
-0.18%
jan 1, 1990
51.783
-0.079
-0.15%
jan 1, 1991
51.706
-0.077
-0.15%
jan 1, 1992
51.635
-0.072
-0.14%
jan 1, 1993
51.574
-0.061
-0.12%
jan 1, 1994
51.524
-0.05
-0.1%
jan 1, 1995
51.484
-0.04
-0.08%
jan 1, 1996
51.453
-0.031
-0.06%
jan 1, 1997
51.428
-0.025
-0.05%
jan 1, 1998
51.409
-0.019
-0.04%
jan 1, 1999
51.398
-0.012
-0.02%
jan 1, 2000
51.395
-0.003
-0.01%
jan 1, 2001
51.4
+0.005
0.01%
jan 1, 2002
51.415
+0.015
0.03%
jan 1, 2003
51.437
+0.022
0.04%
jan 1, 2004
51.459
+0.022
0.04%
jan 1, 2005
51.47
+0.012
0.02%
jan 1, 2006
51.466
-0.004
-0.01%
jan 1, 2007
51.444
-0.023
-0.04%
jan 1, 2008
51.406
-0.037
-0.07%
jan 1, 2009
51.361
-0.045
-0.09%
jan 1, 2010
51.319
-0.043
-0.08%
jan 1, 2011
51.285
-0.033
-0.07%
jan 1, 2012
51.263
-0.023
-0.04%
jan 1, 2013
51.249
-0.014
-0.03%
jan 1, 2014
51.24
-0.008
-0.02%
jan 1, 2015
51.233
-0.007
-0.01%
jan 1, 2016
51.225
-0.008
-0.02%
Ranking of countries by current statistics by years


Comments: