29
/
en
AIzaSyAYiBZKx7MnpbEhh9jyipgxe19OcubqV5w
April 1, 2024
97976
Cabo Verde
CPV
true
2
1
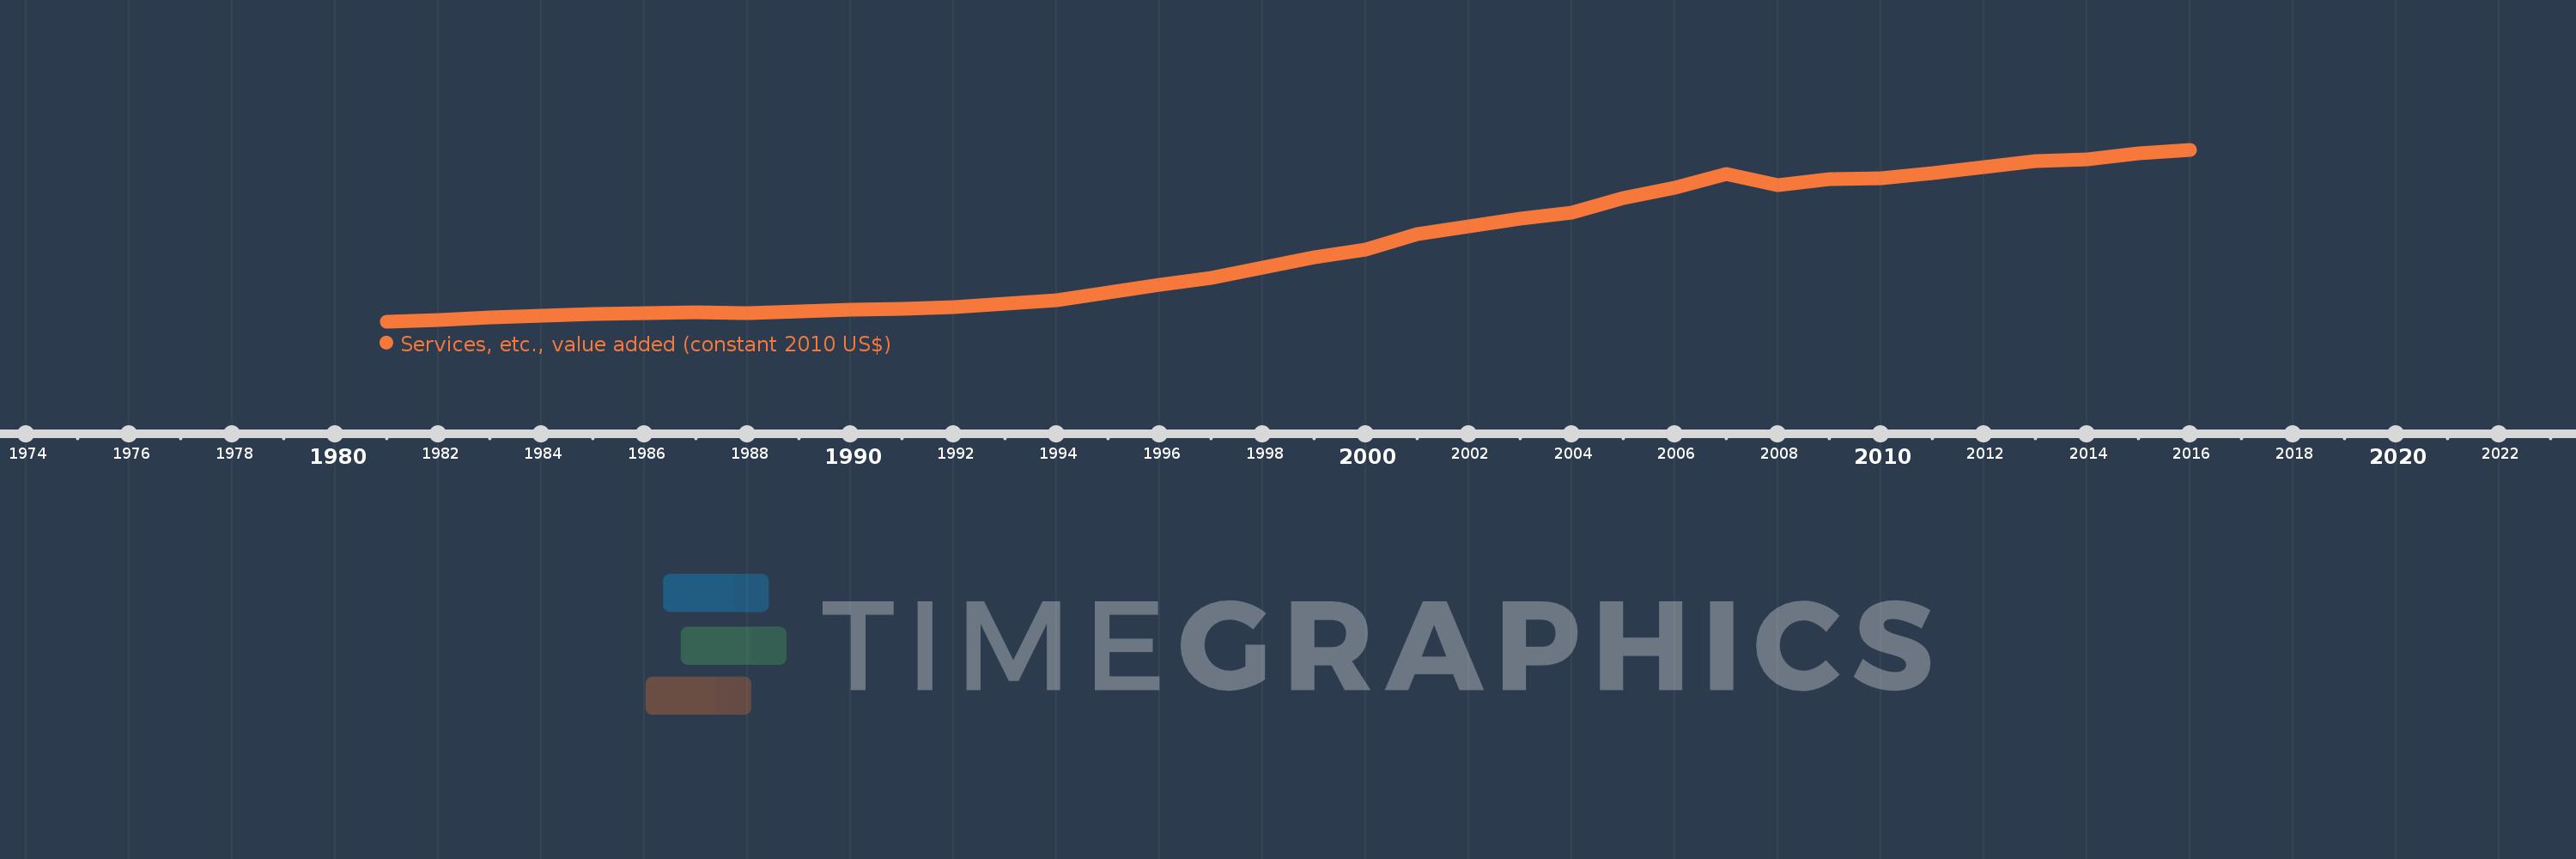
Services, etc., value added (constant 2010 US$)
2016,2015,2014,2013,2012,2011,2010,2009,2008,2007,2006,2005,2004,2003,2002,2001,2000,1999,1998,1997,1996,1995,1994,1993,1992,1991,1990,1989,1988,1987,1986,1985,1984,1983,1982,1981
This statistics in other country:
AfghanistanAlbaniaAlgeriaAndorraAntigua and BarbudaArab WorldArgentinaArmeniaArubaAustraliaAustriaAzerbaijanBahamas, TheBahrainBangladeshBarbadosBelarusBelgiumBelizeBeninBermudaBhutanBoliviaBosnia and HerzegovinaBotswanaBrazilBrunei DarussalamBulgariaBurkina FasoBurundiCabo VerdeCambodiaCameroonCanadaCaribbean small statesCentral African RepublicCentral Europe and the BalticsChadChileChinaColombiaComorosCongo, Dem. Rep.Congo, Rep.Costa RicaCote d'IvoireCroatiaCubaCyprusCzech RepublicDenmarkDominicaDominican RepublicEarly-demographic dividendEast Asia & PacificEast Asia & Pacific (excluding high income)East Asia & Pacific (IDA & IBRD countries)EcuadorEgypt, Arab Rep.El SalvadorEquatorial GuineaEstoniaEthiopiaEuro areaEurope & Central AsiaEurope & Central Asia (excluding high income)Europe & Central Asia (IDA & IBRD countries)European UnionFaroe IslandsFijiFinlandFragile and conflict affected situationsFranceGabonGambia, TheGeorgiaGermanyGhanaGreeceGrenadaGuatemalaGuineaGuinea-BissauGuyanaHeavily indebted poor countries (HIPC)High incomeHondurasHong Kong SAR, ChinaHungaryIBRD onlyIcelandIDA & IBRD totalIDA blendIDA onlyIDA totalIndiaIndonesiaIran, Islamic Rep.IraqIrelandItalyJamaicaJapanJordanKazakhstanKenyaKiribatiKorea, Rep.KosovoKuwaitKyrgyz RepublicLao PDRLate-demographic dividendLatin America & Caribbean Latin America & Caribbean (excluding high income)Latin America & the Caribbean (IDA & IBRD countries)LatviaLeast developed countries: UN classificationLebanonLesothoLiberiaLithuaniaLow & middle incomeLow incomeLower middle incomeLuxembourgMacao SAR, ChinaMacedonia, FYRMadagascarMalawiMalaysiaMaldivesMaliMaltaMarshall IslandsMauritaniaMauritiusMexicoMicronesia, Fed. Sts.Middle East & North AfricaMiddle East & North Africa (excluding high income)Middle East & North Africa (IDA & IBRD countries)Middle incomeMoldovaMongoliaMontenegroMoroccoMozambiqueMyanmarNamibiaNepalNetherlandsNew ZealandNicaraguaNigerNigeriaNorth AmericaNorwayOECD membersOmanOther small statesPacific island small statesPakistanPalauPanamaParaguayPeruPhilippinesPolandPortugalPost-demographic dividendPre-demographic dividendPuerto RicoQatarRomaniaRussian FederationRwandaSamoaSao Tome and PrincipeSaudi ArabiaSenegalSerbiaSeychellesSierra LeoneSingaporeSlovak RepublicSloveniaSmall statesSouth AfricaSouth AsiaSouth Asia (IDA & IBRD)SpainSri LankaSt. Kitts and NevisSt. LuciaSt. Vincent and the GrenadinesSub-Saharan Africa Sub-Saharan Africa (excluding high income)Sub-Saharan Africa (IDA & IBRD countries)SudanSurinameSwazilandSwedenSwitzerlandTajikistanTanzaniaThailandTimor-LesteTogoTongaTrinidad and TobagoTunisiaTurkeyTurkmenistanTuvaluUgandaUkraineUnited Arab EmiratesUnited KingdomUnited StatesUpper middle incomeUruguayUzbekistanVanuatuVenezuela, RBVietnamWest Bank and GazaWorldYemen, Rep.ZambiaZimbabwe Timeline:
This timeline shows a graph from 1981 to 2016 of Cabo Verde. No data until 1980. Number of actual observations by date: 36.
Source name:
World Development Indicators
Source organization:
World Bank national accounts data, and OECD National Accounts data files.
Categories, topics:
Economy & Growth
Last updated:
apr 23, 2017
Indicators value changes by year
Minimum:
115.938 mln
jan 1, 1981
Maximum:
1.155 bln
jan 1, 2016
At the date of observation
Value
Absolute change
Change from previous value
jan 1, 1981
115.938 mln
+115.938 mln
0.0%
jan 1, 1982
129.729 mln
+13.791 mln
11.9%
jan 1, 1983
141.776 mln
+12.047 mln
9.29%
jan 1, 1984
155.348 mln
+13.572 mln
9.57%
jan 1, 1985
163.381 mln
+8.032 mln
5.17%
jan 1, 1986
170.301 mln
+6.92 mln
4.24%
jan 1, 1987
174.273 mln
+3.972 mln
2.33%
jan 1, 1988
168.802 mln
-5.471 mln
-3.14%
jan 1, 1989
179.535 mln
+10.733 mln
6.36%
jan 1, 1990
191.209 mln
+11.674 mln
6.5%
jan 1, 1991
197.906 mln
+6.697 mln
3.5%
jan 1, 1992
203.237 mln
+5.331 mln
2.69%
jan 1, 1993
227.406 mln
+24.169 mln
11.89%
jan 1, 1994
245.269 mln
+17.863 mln
7.86%
jan 1, 1995
296.185 mln
+50.917 mln
20.76%
jan 1, 1996
341.576 mln
+45.391 mln
15.33%
jan 1, 1997
382.146 mln
+40.569 mln
11.88%
jan 1, 1998
443.321 mln
+61.176 mln
16.01%
jan 1, 1999
505.893 mln
+62.572 mln
14.11%
jan 1, 2000
555.202 mln
+49.309 mln
9.75%
jan 1, 2001
649.642 mln
+94.439 mln
17.01%
jan 1, 2002
695.671 mln
+46.029 mln
7.09%
jan 1, 2003
739.346 mln
+43.675 mln
6.28%
jan 1, 2004
777.583 mln
+38.238 mln
5.17%
jan 1, 2005
866.117 mln
+88.534 mln
11.39%
jan 1, 2006
928.92 mln
+62.803 mln
7.25%
jan 1, 2007
1.011 bln
+82.133 mln
8.84%
jan 1, 2008
940.832 mln
-70.221 mln
-6.95%
jan 1, 2009
981.193 mln
+40.361 mln
4.29%
jan 1, 2010
985.223 mln
+4.03 mln
0.41%
jan 1, 2011
1.018 bln
+32.694 mln
3.32%
jan 1, 2012
1.05 bln
+32.347 mln
3.18%
jan 1, 2013
1.09 bln
+40.166 mln
3.82%
jan 1, 2014
1.097 bln
+6.509 mln
0.6%
jan 1, 2015
1.138 bln
+40.915 mln
3.73%
jan 1, 2016
1.155 bln
+16.69 mln
1.47%
Ranking of countries by current statistics by years


Comments: