29
/
en
AIzaSyAYiBZKx7MnpbEhh9jyipgxe19OcubqV5w
April 1, 2024
95313
Burkina Faso
BFA
true
2
1
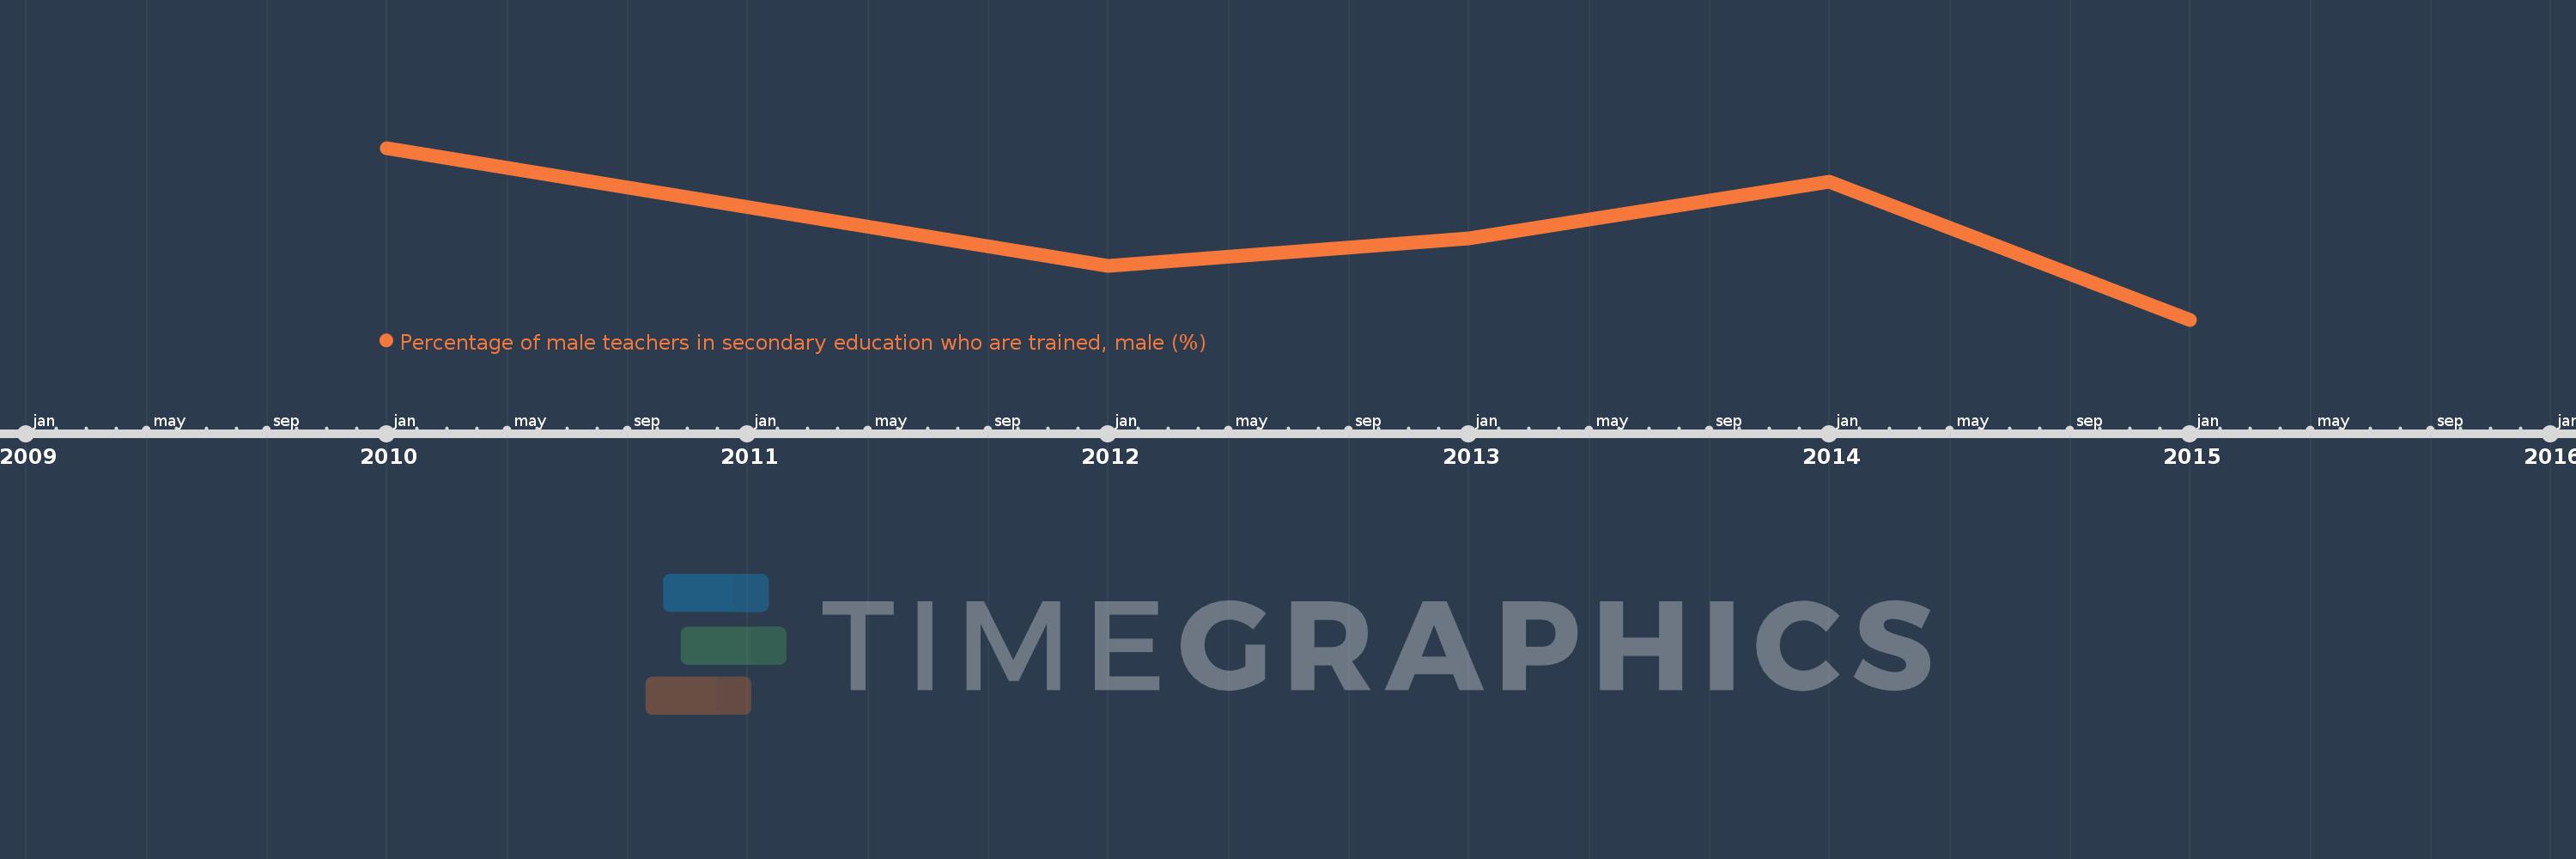
Percentage of male teachers in secondary education who are trained, male (%)
2015,2014,2013,2012,2010
This statistics in other country:
Timeline:
This timeline shows a graph from 2010 to 2015 of Burkina Faso. No data until 2009. Number of actual observations by date: 5.
Source name:
World Development Indicators
Source organization:
UNESCO Institute for Statistics
Categories, topics:
Education
Last updated:
apr 23, 2017
Indicators value changes by year
Minimum:
46.365
jan 1, 2015
Maximum:
48.832
jan 1, 2010
At the date of observation
Value
Absolute change
Change from previous value
jan 1, 2010
48.832
+48.832
0.0%
jan 1, 2012
47.138
-1.694
-3.47%
jan 1, 2013
47.528
+0.39
0.83%
jan 1, 2014
48.348
+0.82
1.72%
jan 1, 2015
46.365
-1.983
-4.1%
Ranking of countries by current statistics by years


Comments: