29
/
en
AIzaSyAYiBZKx7MnpbEhh9jyipgxe19OcubqV5w
April 1, 2024
94192
Bulgaria
BGR
true
2
1
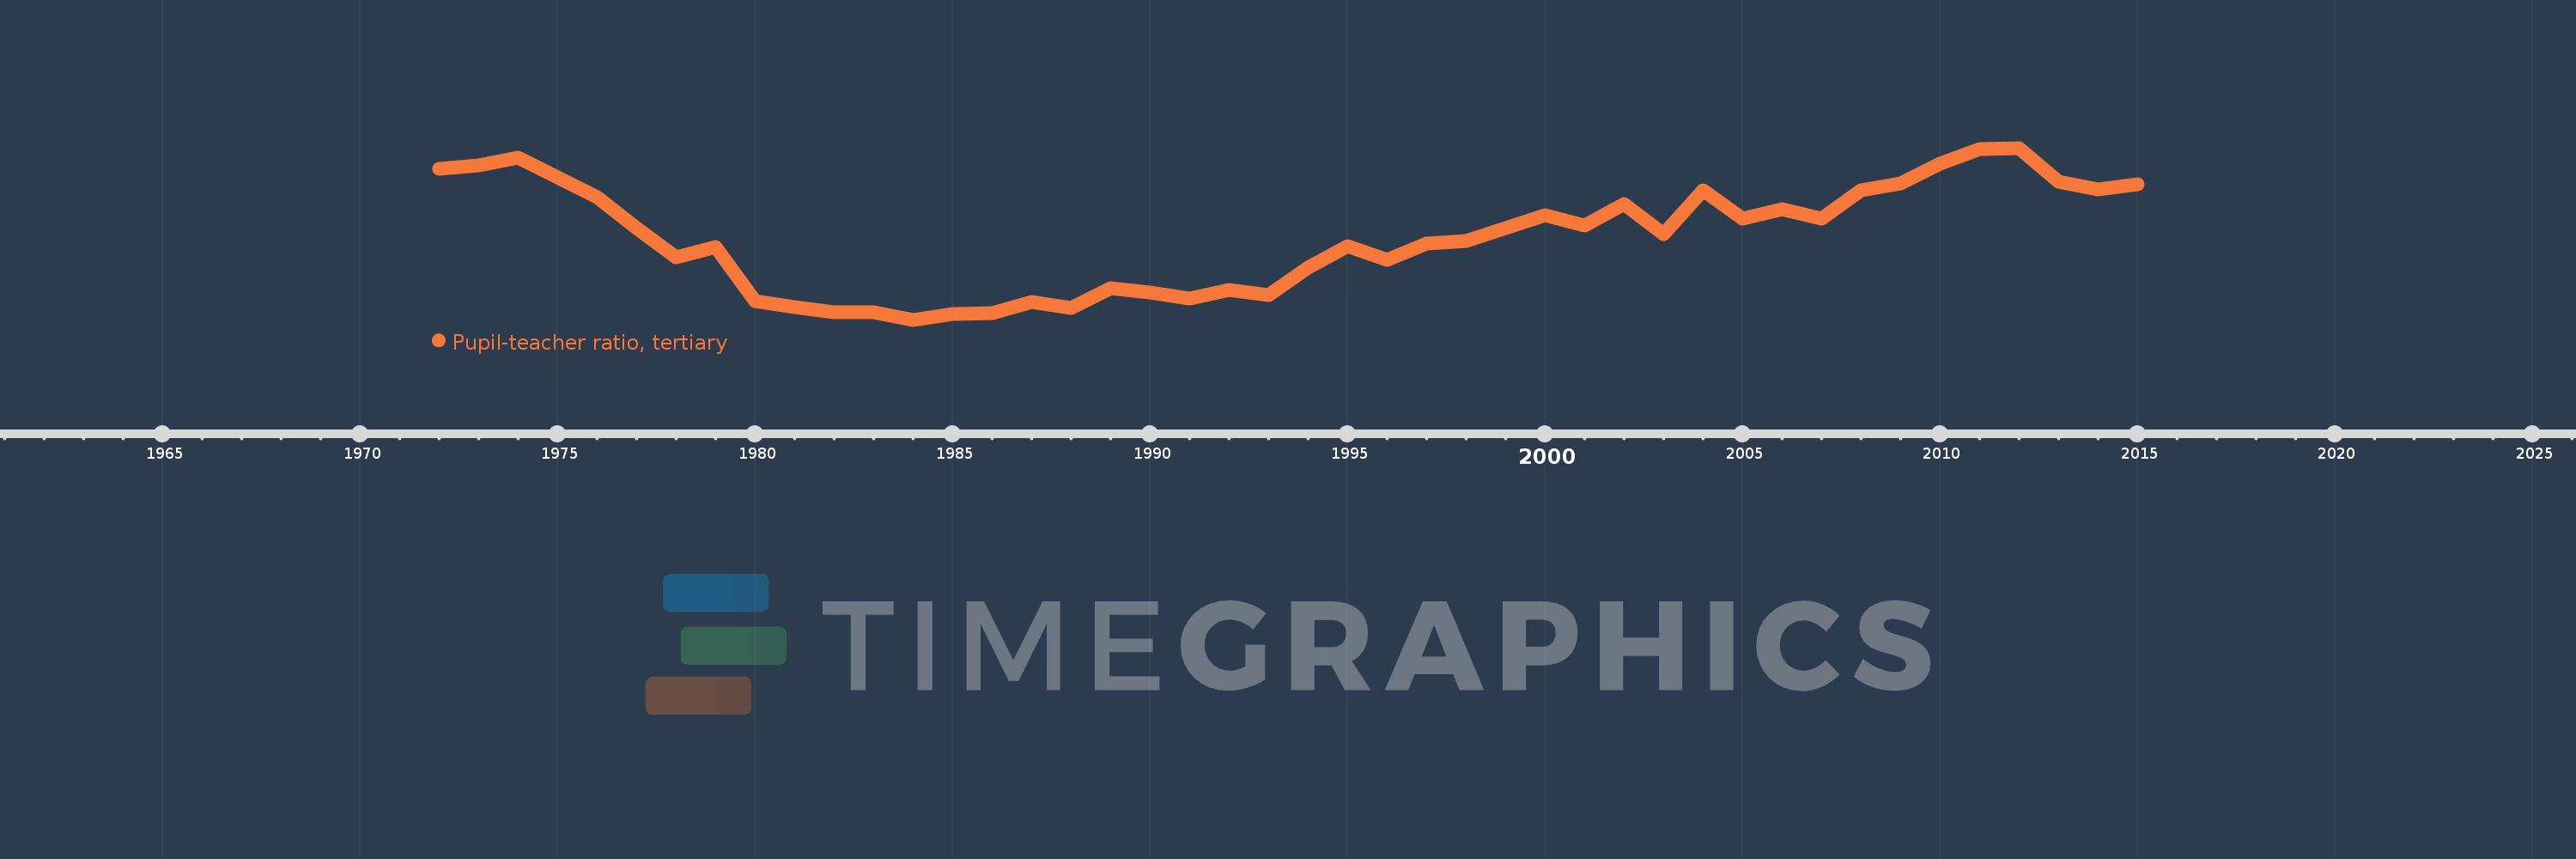
Pupil-teacher ratio, tertiary
2015,2014,2013,2012,2011,2010,2009,2008,2007,2006,2005,2004,2003,2002,2001,2000,1998,1997,1996,1995,1994,1993,1992,1991,1990,1989,1988,1987,1986,1985,1984,1983,1982,1981,1980,1979,1978,1977,1976,1975,1974,1973,1972
This statistics in other country:
AfghanistanAlbaniaAlgeriaAndorraAngolaAntigua and BarbudaArgentinaArmeniaArubaAustraliaAustriaAzerbaijanBahamas, TheBahrainBangladeshBarbadosBelarusBelgiumBelizeBeninBermudaBhutanBoliviaBosnia and HerzegovinaBotswanaBrazilBritish Virgin IslandsBrunei DarussalamBulgariaBurkina FasoBurundiCabo VerdeCambodiaCameroonCanadaCayman IslandsCentral African RepublicChadChileChinaColombiaComorosCongo, Dem. Rep.Congo, Rep.Costa RicaCote d'IvoireCroatiaCubaCyprusCzech RepublicDenmarkDjiboutiDominicaDominican RepublicEcuadorEgypt, Arab Rep.El SalvadorEquatorial GuineaEritreaEstoniaEthiopiaFijiFinlandFranceGabonGambia, TheGeorgiaGermanyGhanaGreeceGrenadaGuatemalaGuineaGuinea-BissauGuyanaHaitiHondurasHong Kong SAR, ChinaHungaryIcelandIndiaIndonesiaIran, Islamic Rep.IraqIrelandIsraelItalyJamaicaJapanJordanKazakhstanKorea, Dem. People’s Rep.Korea, Rep.KuwaitKyrgyz RepublicLao PDRLatviaLebanonLesothoLiberiaLibyaLiechtensteinLithuaniaLuxembourgMacao SAR, ChinaMacedonia, FYRMadagascarMalawiMalaysiaMaldivesMaliMaltaMarshall IslandsMauritaniaMauritiusMexicoMicronesia, Fed. Sts.MoldovaMongoliaMoroccoMozambiqueMyanmarNamibiaNepalNetherlandsNew ZealandNicaraguaNigerNigeriaNorwayOmanPakistanPalauPanamaPapua New GuineaParaguayPeruPhilippinesPolandPortugalPuerto RicoQatarRomaniaRussian FederationRwandaSamoaSao Tome and PrincipeSaudi ArabiaSenegalSerbiaSeychellesSierra LeoneSingaporeSint Maarten (Dutch part)Slovak RepublicSloveniaSomaliaSouth AfricaSpainSri LankaSt. Kitts and NevisSt. LuciaSt. Vincent and the GrenadinesSudanSurinameSwazilandSwedenSwitzerlandSyrian Arab RepublicTajikistanTanzaniaThailandTimor-LesteTogoTongaTrinidad and TobagoTunisiaTurkeyTurkmenistanUgandaUkraineUnited Arab EmiratesUnited KingdomUnited StatesUruguayUzbekistanVanuatuVenezuela, RBVietnamWest Bank and GazaYemen, Rep.ZambiaZimbabwe Timeline:
This timeline shows a graph from 1972 to 2015 of Bulgaria. No data until 1971. Number of actual observations by date: 43.
Source name:
World Development Indicators
Source organization:
United Nations Educational, Scientific, and Cultural Organization (UNESCO) Institute for Statistics.
Categories, topics:
Education
Last updated:
apr 23, 2017
Indicators value changes by year
Maximum:
13.816
jan 1, 2012
At the date of observation
Value
Absolute change
Change from previous value
jan 1, 1972
12.968
+12.968
0.0%
jan 1, 1973
13.096
+0.128
0.99%
jan 1, 1974
13.405
+0.309
2.36%
jan 1, 1975
12.599
-0.805
-6.01%
jan 1, 1976
11.783
-0.816
-6.48%
jan 1, 1977
10.515
-1.269
-10.77%
jan 1, 1978
9.288
-1.227
-11.67%
jan 1, 1979
9.732
+0.444
4.79%
jan 1, 1980
7.512
-2.22
-22.81%
jan 1, 1981
7.265
-0.248
-3.3%
jan 1, 1982
7.033
-0.232
-3.19%
jan 1, 1983
7.03
-0.003
-0.04%
jan 1, 1984
6.728
-0.302
-4.29%
jan 1, 1985
6.959
+0.23
3.43%
jan 1, 1986
6.994
+0.035
0.5%
jan 1, 1987
7.461
+0.467
6.68%
jan 1, 1988
7.206
-0.255
-3.42%
jan 1, 1989
8.039
+0.833
11.56%
jan 1, 1990
7.864
-0.174
-2.17%
jan 1, 1991
7.607
-0.257
-3.27%
jan 1, 1992
7.965
+0.358
4.71%
jan 1, 1993
7.761
-0.204
-2.56%
jan 1, 1994
8.894
+1.132
14.59%
jan 1, 1995
9.749
+0.856
9.62%
jan 1, 1996
9.188
-0.561
-5.76%
jan 1, 1997
9.879
+0.691
7.53%
jan 1, 1998
9.99
+0.11
1.11%
jan 1, 2000
11.049
+1.059
10.6%
jan 1, 2001
10.614
-0.435
-3.93%
jan 1, 2002
11.495
+0.88
8.29%
jan 1, 2003
10.25
-1.245
-10.83%
jan 1, 2004
12.066
+1.817
17.72%
jan 1, 2005
10.909
-1.158
-9.59%
jan 1, 2006
11.274
+0.366
3.35%
jan 1, 2007
10.915
-0.36
-3.19%
jan 1, 2008
12.062
+1.147
10.51%
jan 1, 2009
12.37
+0.308
2.55%
jan 1, 2010
13.155
+0.785
6.35%
jan 1, 2011
13.766
+0.611
4.65%
jan 1, 2012
13.816
+0.05
0.36%
jan 1, 2013
12.415
-1.4
-10.14%
jan 1, 2014
12.106
-0.309
-2.49%
jan 1, 2015
12.311
+0.205
1.69%
Ranking of countries by current statistics by years


Comments: