29
/
en
AIzaSyAYiBZKx7MnpbEhh9jyipgxe19OcubqV5w
April 1, 2024
94094
Bulgaria
BGR
true
2
1
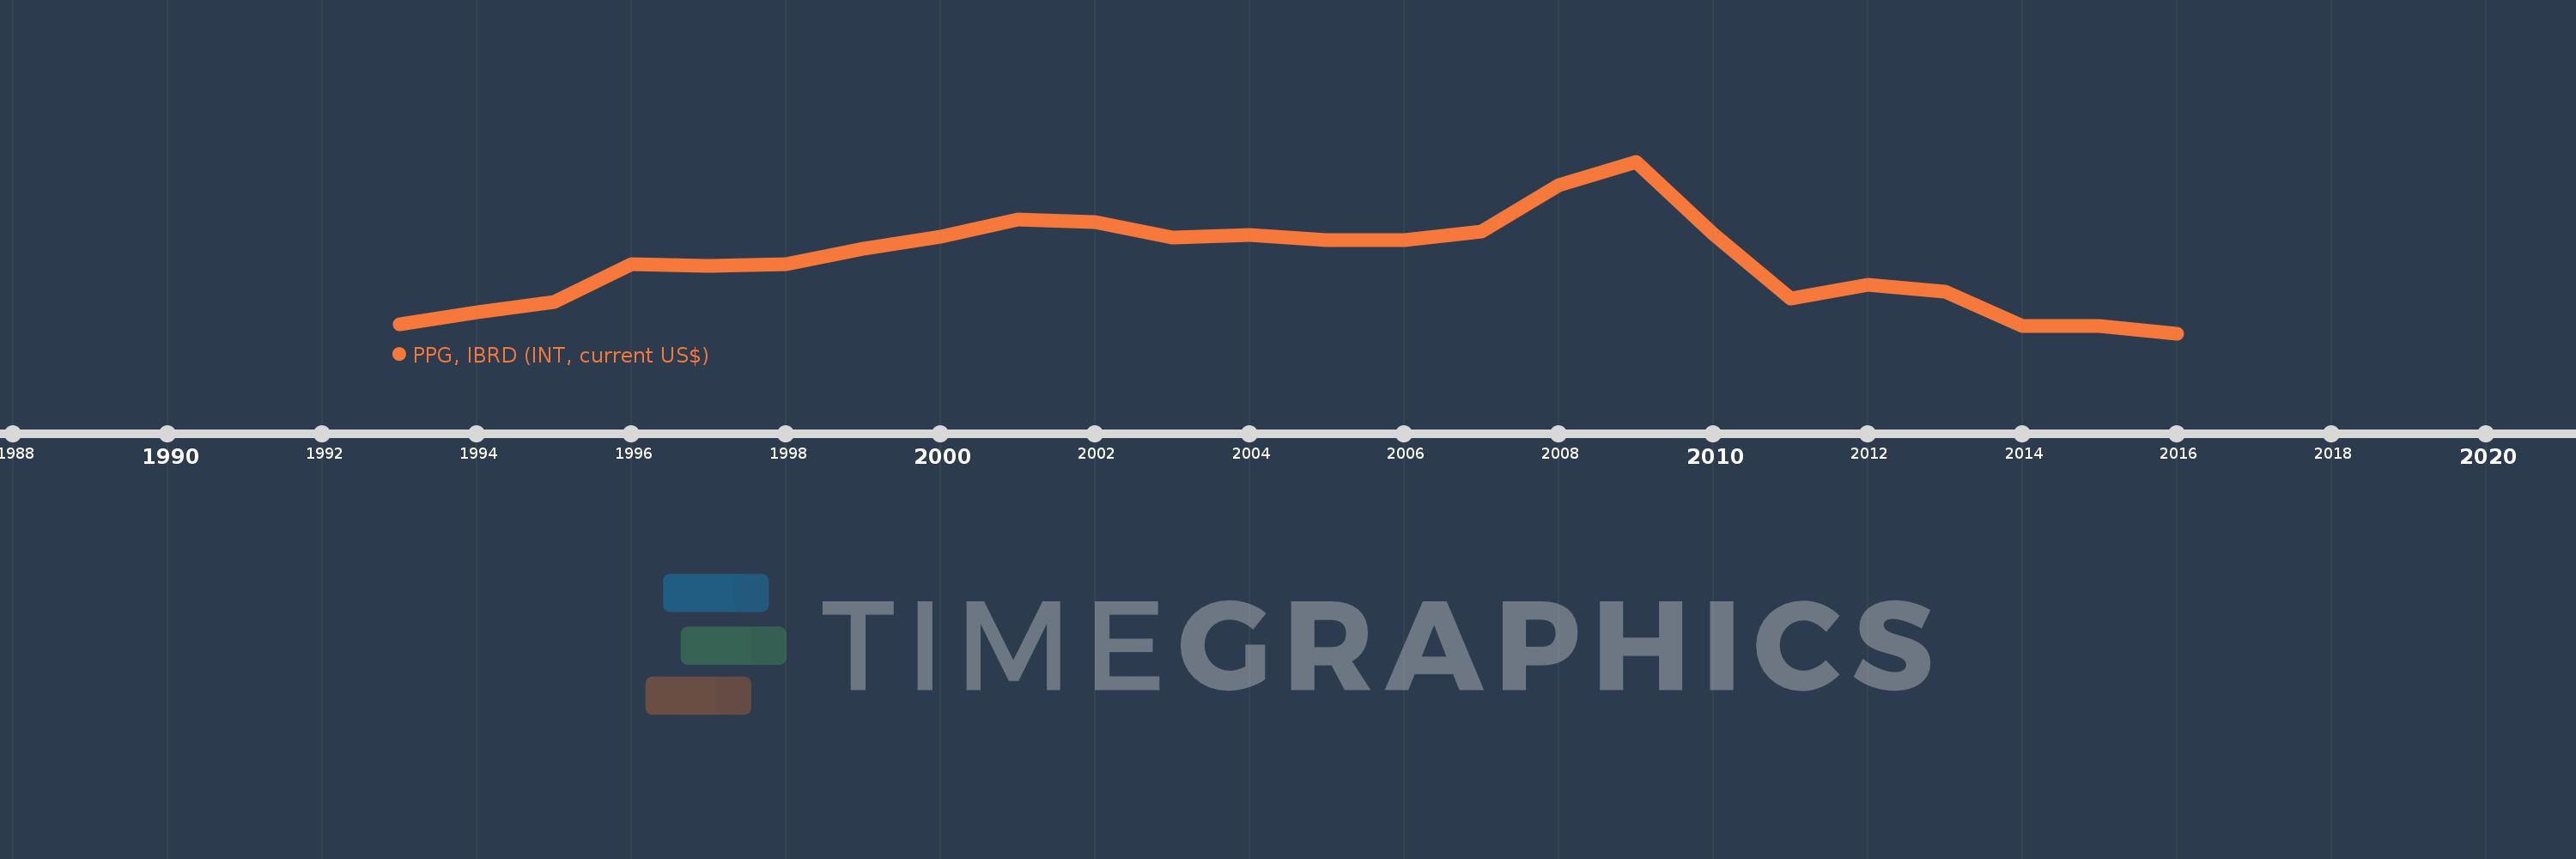
PPG, IBRD (INT, current US$)
2016,2015,2014,2013,2012,2011,2010,2009,2008,2007,2006,2005,2004,2003,2002,2001,2000,1999,1998,1997,1996,1995,1994,1993
This statistics in other country:
Timeline:
This timeline shows a graph from 1993 to 2016 of Bulgaria. No data until 1992. Number of actual observations by date: 24.
Source name:
World Development Indicators
Source organization:
World Bank, International Debt Statistics.
Categories, topics:
External Debt
Last updated:
apr 23, 2017
Indicators value changes by year
Minimum:
2.995 mln
jan 1, 2016
Maximum:
71.937 mln
jan 1, 2009
At the date of observation
Value
Absolute change
Change from previous value
jan 1, 1993
6.692 mln
+6.692 mln
0.0%
jan 1, 1994
11.517 mln
+4.825 mln
72.1%
jan 1, 1995
15.429 mln
+3.912 mln
33.97%
jan 1, 1996
30.731 mln
+15.302 mln
99.18%
jan 1, 1997
29.96 mln
-771.0K
-2.51%
jan 1, 1998
30.656 mln
+696.0K
2.32%
jan 1, 1999
36.865 mln
+6.209 mln
20.25%
jan 1, 2000
41.937 mln
+5.072 mln
13.76%
jan 1, 2001
48.73 mln
+6.793 mln
16.2%
jan 1, 2002
47.632 mln
-1.098 mln
-2.25%
jan 1, 2003
41.474 mln
-6.158 mln
-12.93%
jan 1, 2004
42.45 mln
+976.0K
2.35%
jan 1, 2005
40.567 mln
-1.883 mln
-4.44%
jan 1, 2006
40.477 mln
-90.0K
-0.22%
jan 1, 2007
43.955 mln
+3.478 mln
8.59%
jan 1, 2008
62.379 mln
+18.424 mln
41.92%
jan 1, 2009
71.937 mln
+9.558 mln
15.32%
jan 1, 2010
42.897 mln
-29.04 mln
-40.37%
jan 1, 2011
16.916 mln
-25.981 mln
-60.57%
jan 1, 2012
22.563 mln
+5.647 mln
33.38%
jan 1, 2013
19.703 mln
-2.86 mln
-12.68%
jan 1, 2014
5.764 mln
-13.939 mln
-70.75%
jan 1, 2015
5.89 mln
+126.0K
2.19%
jan 1, 2016
2.995 mln
-2.895 mln
-49.15%
Ranking of countries by current statistics by years


Comments: