29
/
en
AIzaSyAYiBZKx7MnpbEhh9jyipgxe19OcubqV5w
April 1, 2024
94024
Bulgaria
BGR
true
2
1
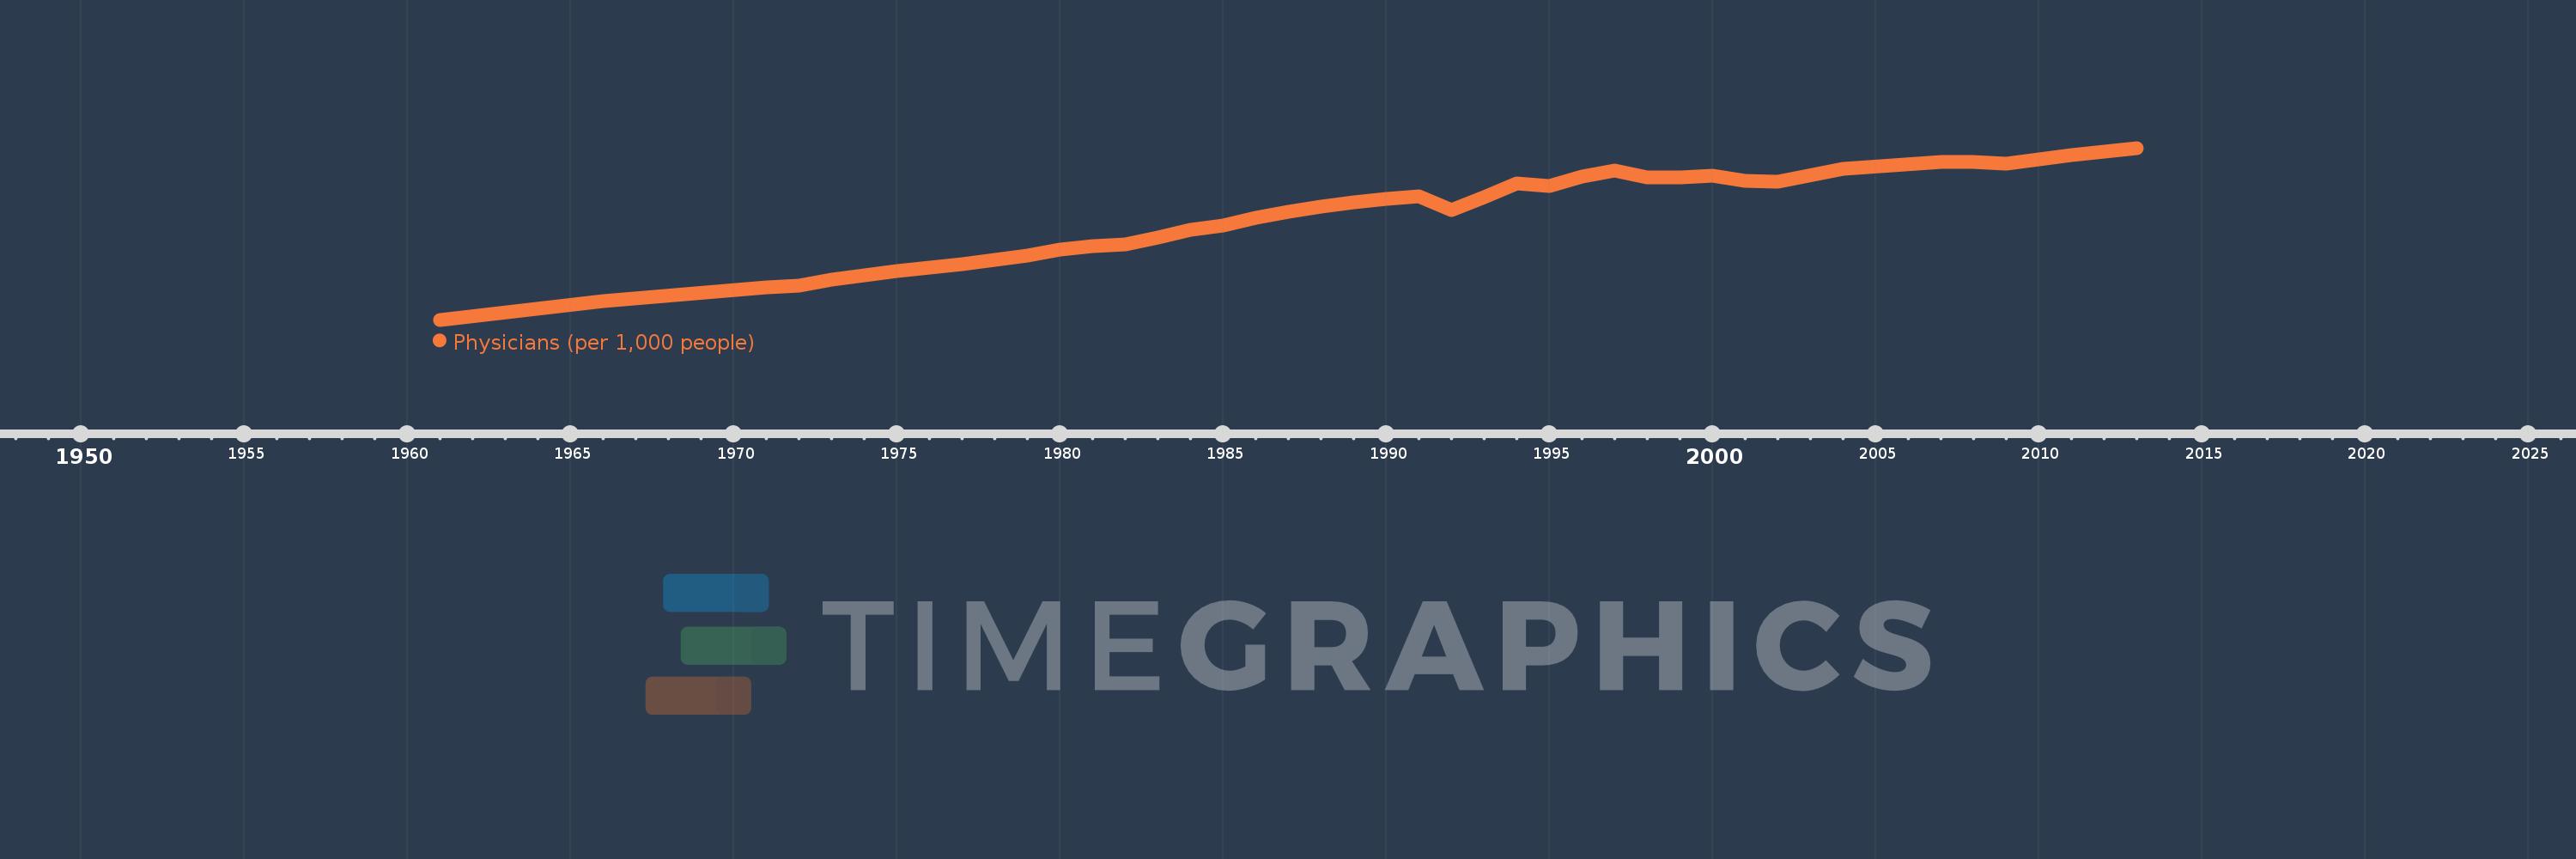
Physicians (per 1,000 people)
2013,2012,2011,2009,2008,2007,2004,2002,2001,2000,1999,1998,1997,1996,1995,1994,1993,1992,1991,1990,1989,1988,1987,1986,1985,1984,1983,1982,1981,1980,1979,1978,1977,1976,1975,1974,1973,1972,1971,1966,1961
This statistics in other country:
AfghanistanAlbaniaAlgeriaAmerican SamoaAndorraAngolaAntigua and BarbudaArab WorldArgentinaArmeniaArubaAustraliaAustriaAzerbaijanBahamas, TheBahrainBangladeshBarbadosBelarusBelgiumBelizeBeninBermudaBhutanBoliviaBosnia and HerzegovinaBotswanaBrazilBrunei DarussalamBulgariaBurkina FasoBurundiCabo VerdeCambodiaCameroonCanadaCaribbean small statesCayman IslandsCentral African RepublicCentral Europe and the BalticsChadChannel IslandsChileChinaColombiaComorosCongo, Dem. Rep.Congo, Rep.Costa RicaCote d'IvoireCroatiaCubaCyprusCzech RepublicDenmarkDjiboutiDominicaDominican RepublicEarly-demographic dividendEast Asia & PacificEast Asia & Pacific (excluding high income)East Asia & Pacific (IDA & IBRD countries)EcuadorEgypt, Arab Rep.El SalvadorEquatorial GuineaEritreaEstoniaEthiopiaEuro areaEurope & Central AsiaEurope & Central Asia (excluding high income)Europe & Central Asia (IDA & IBRD countries)European UnionFijiFinlandFragile and conflict affected situationsFranceFrench PolynesiaGabonGambia, TheGeorgiaGermanyGhanaGreeceGreenlandGrenadaGuamGuatemalaGuineaGuinea-BissauGuyanaHaitiHeavily indebted poor countries (HIPC)High incomeHondurasHong Kong SAR, ChinaHungaryIBRD onlyIcelandIDA & IBRD totalIDA blendIDA onlyIDA totalIndiaIndonesiaIran, Islamic Rep.IraqIrelandIsraelItalyJamaicaJapanJordanKazakhstanKenyaKiribatiKorea, Dem. People’s Rep.Korea, Rep.KuwaitKyrgyz RepublicLao PDRLate-demographic dividendLatin America & Caribbean Latin America & Caribbean (excluding high income)Latin America & the Caribbean (IDA & IBRD countries)LatviaLeast developed countries: UN classificationLebanonLesothoLiberiaLibyaLithuaniaLow & middle incomeLow incomeLower middle incomeLuxembourgMacao SAR, ChinaMacedonia, FYRMadagascarMalawiMalaysiaMaldivesMaliMaltaMarshall IslandsMauritaniaMauritiusMexicoMicronesia, Fed. Sts.Middle East & North AfricaMiddle East & North Africa (excluding high income)Middle East & North Africa (IDA & IBRD countries)Middle incomeMoldovaMonacoMongoliaMontenegroMoroccoMozambiqueMyanmarNamibiaNauruNepalNetherlandsNew CaledoniaNew ZealandNicaraguaNigerNigeriaNorth AmericaNorthern Mariana IslandsNorwayOECD membersOmanOther small statesPacific island small statesPakistanPalauPanamaPapua New GuineaParaguayPeruPhilippinesPolandPortugalPost-demographic dividendPre-demographic dividendPuerto RicoQatarRomaniaRussian FederationRwandaSamoaSan MarinoSao Tome and PrincipeSaudi ArabiaSenegalSerbiaSeychellesSierra LeoneSingaporeSlovak RepublicSloveniaSmall statesSolomon IslandsSomaliaSouth AfricaSouth AsiaSouth Asia (IDA & IBRD)SpainSri LankaSt. Kitts and NevisSt. LuciaSt. Vincent and the GrenadinesSub-Saharan Africa Sub-Saharan Africa (excluding high income)Sub-Saharan Africa (IDA & IBRD countries)SudanSurinameSwazilandSwedenSwitzerlandSyrian Arab RepublicTajikistanTanzaniaThailandTimor-LesteTogoTongaTrinidad and TobagoTunisiaTurkeyTurkmenistanTuvaluUgandaUkraineUnited Arab EmiratesUnited KingdomUnited StatesUpper middle incomeUruguayUzbekistanVanuatuVenezuela, RBVietnamVirgin Islands (U.S.)West Bank and GazaWorldYemen, Rep.ZambiaZimbabwe Timeline:
This timeline shows a graph from 1961 to 2013 of Bulgaria. No data until 1960. Number of actual observations by date: 41.
Source name:
World Development Indicators
Source organization:
World Health Organization's Global Health Workforce Statistics, OECD, supplemented by country data.
Categories, topics:
Health
Last updated:
apr 23, 2017
Indicators value changes by year
At the date of observation
Value
Absolute change
Change from previous value
jan 1, 1961
1.405
+1.405
0.0%
jan 1, 1966
1.667
+0.262
18.64%
jan 1, 1971
1.863
+0.197
11.8%
jan 1, 1972
1.896
+0.033
1.74%
jan 1, 1973
1.985
+0.089
4.7%
jan 1, 1974
2.042
+0.057
2.86%
jan 1, 1975
2.102
+0.06
2.93%
jan 1, 1976
2.152
+0.051
2.41%
jan 1, 1977
2.205
+0.053
2.45%
jan 1, 1978
2.258
+0.053
2.4%
jan 1, 1979
2.321
+0.063
2.78%
jan 1, 1980
2.408
+0.087
3.75%
jan 1, 1981
2.46
+0.052
2.16%
jan 1, 1982
2.484
+0.025
1.0%
jan 1, 1983
2.588
+0.104
4.19%
jan 1, 1984
2.688
+0.099
3.83%
jan 1, 1985
2.759
+0.071
2.64%
jan 1, 1986
2.865
+0.106
3.85%
jan 1, 1987
2.953
+0.088
3.08%
jan 1, 1988
3.022
+0.069
2.32%
jan 1, 1989
3.09
+0.068
2.26%
jan 1, 1990
3.139
+0.049
1.6%
jan 1, 1991
3.17
+0.031
0.97%
jan 1, 1992
2.979
-0.19
-6.0%
jan 1, 1993
3.166
+0.187
6.27%
jan 1, 1994
3.359
+0.193
6.09%
jan 1, 1995
3.327
-0.031
-0.94%
jan 1, 1996
3.458
+0.131
3.93%
jan 1, 1997
3.539
+0.081
2.34%
jan 1, 1998
3.447
-0.092
-2.6%
jan 1, 1999
3.449
+0.002
0.06%
jan 1, 2000
3.463
+0.014
0.41%
jan 1, 2001
3.399
-0.064
-1.85%
jan 1, 2002
3.384
-0.015
-0.44%
jan 1, 2004
3.562
+0.178
5.26%
jan 1, 2007
3.66
+0.098
2.75%
jan 1, 2008
3.665
+0.005
0.14%
jan 1, 2009
3.635
-0.03
-0.82%
jan 1, 2011
3.76
+0.125
3.44%
jan 1, 2012
3.812
+0.052
1.38%
jan 1, 2013
3.866
+0.054
1.42%
Ranking of countries by current statistics by years


Comments: