29
/
en
AIzaSyAYiBZKx7MnpbEhh9jyipgxe19OcubqV5w
April 1, 2024
93659
Bulgaria
BGR
true
2
1
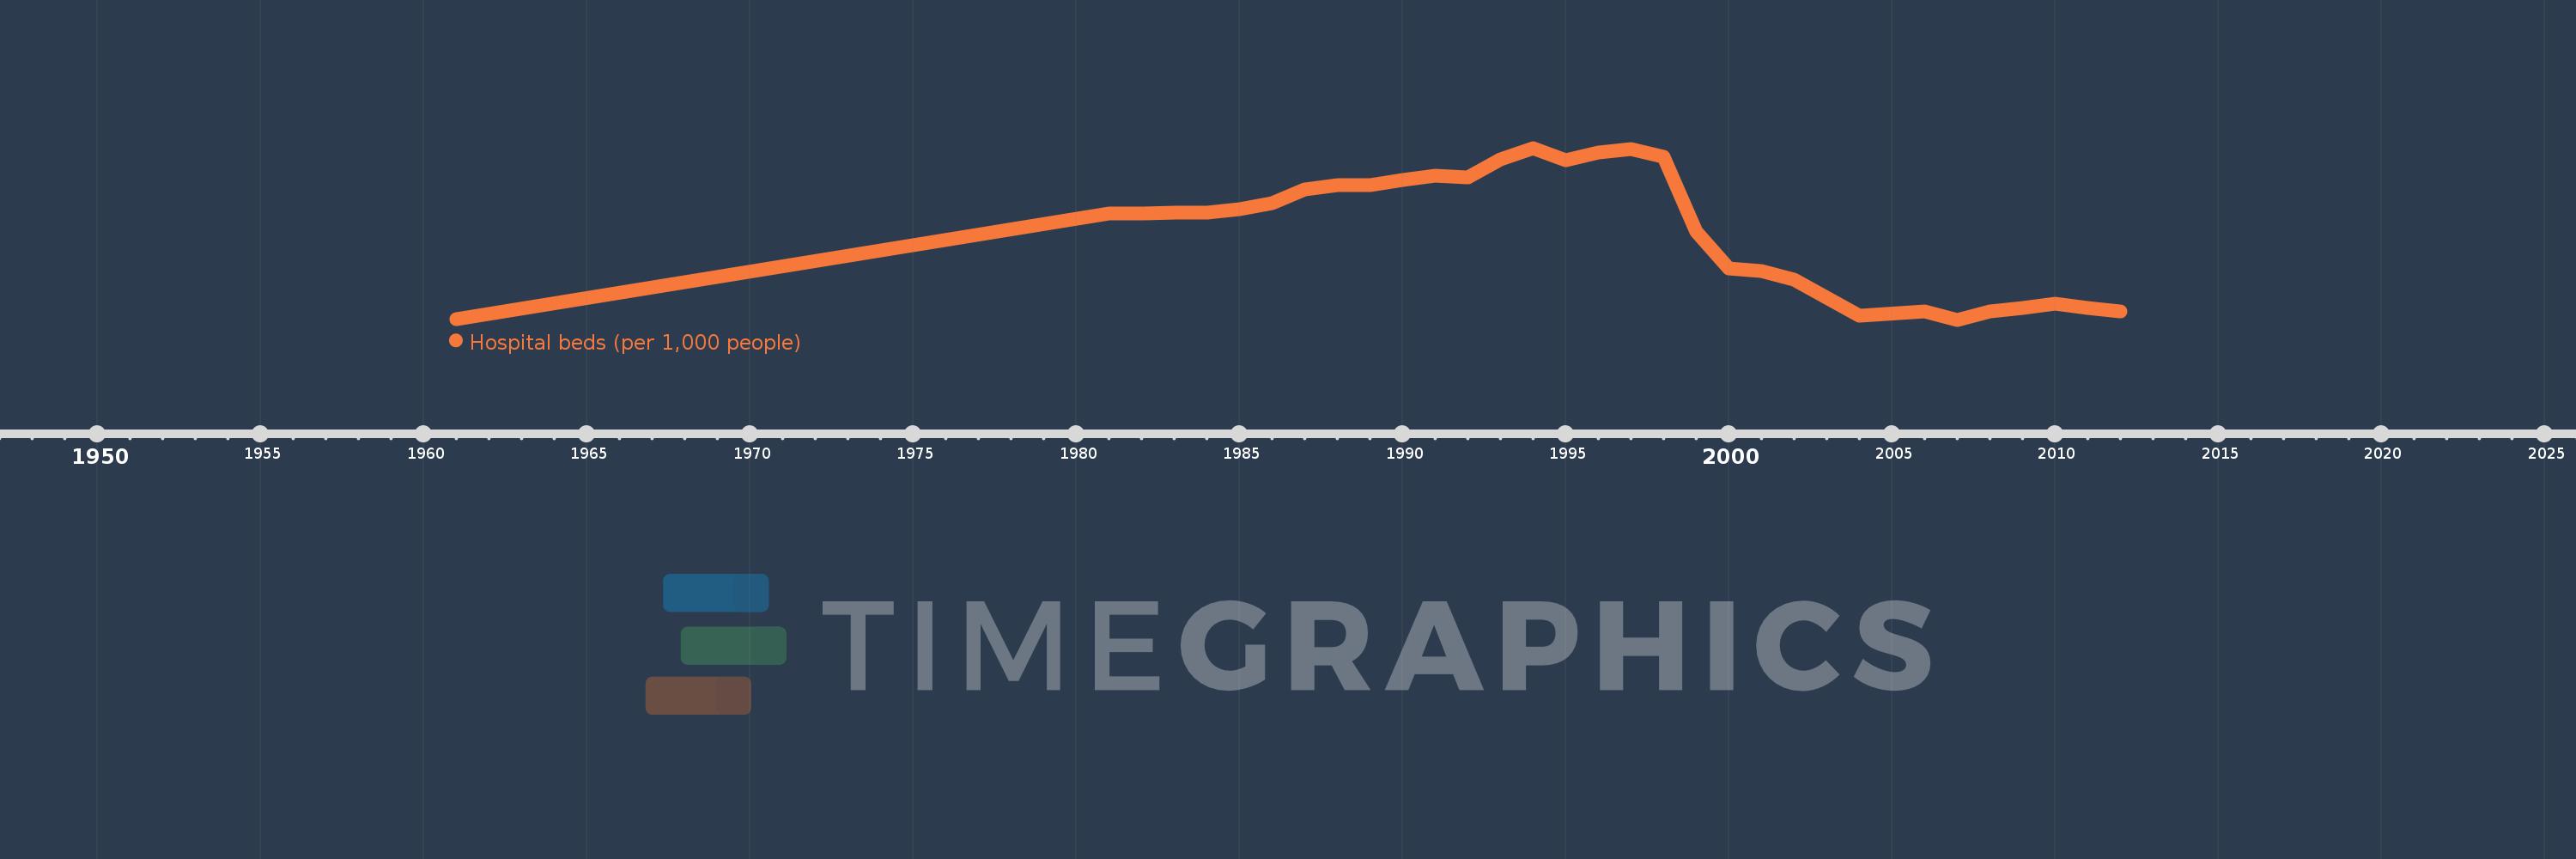
Hospital beds (per 1,000 people)
2012,2011,2010,2009,2008,2007,2006,2004,2002,2001,2000,1999,1998,1997,1996,1995,1994,1993,1992,1991,1990,1989,1988,1987,1986,1985,1984,1983,1982,1981,1961
This statistics in other country:
AfghanistanAlbaniaAlgeriaAndorraAngolaAntigua and BarbudaArab WorldArgentinaArmeniaAustraliaAustriaAzerbaijanBahamas, TheBahrainBangladeshBarbadosBelarusBelgiumBelizeBeninBermudaBhutanBoliviaBosnia and HerzegovinaBotswanaBrazilBrunei DarussalamBulgariaBurkina FasoBurundiCabo VerdeCambodiaCameroonCanadaCaribbean small statesCayman IslandsCentral African RepublicCentral Europe and the BalticsChadChannel IslandsChileChinaColombiaComorosCongo, Dem. Rep.Congo, Rep.Costa RicaCote d'IvoireCroatiaCubaCyprusCzech RepublicDenmarkDjiboutiDominicaDominican RepublicEarly-demographic dividendEast Asia & PacificEast Asia & Pacific (excluding high income)East Asia & Pacific (IDA & IBRD countries)EcuadorEgypt, Arab Rep.El SalvadorEquatorial GuineaEritreaEstoniaEthiopiaEuro areaEurope & Central AsiaEurope & Central Asia (excluding high income)Europe & Central Asia (IDA & IBRD countries)European UnionFijiFinlandFragile and conflict affected situationsFranceGabonGambia, TheGeorgiaGermanyGhanaGreeceGreenlandGrenadaGuatemalaGuineaGuinea-BissauGuyanaHaitiHeavily indebted poor countries (HIPC)High incomeHondurasHong Kong SAR, ChinaHungaryIBRD onlyIcelandIDA & IBRD totalIDA blendIDA onlyIDA totalIndiaIndonesiaIran, Islamic Rep.IraqIrelandIsraelItalyJamaicaJapanJordanKazakhstanKenyaKiribatiKorea, Dem. People’s Rep.Korea, Rep.KuwaitKyrgyz RepublicLao PDRLate-demographic dividendLatin America & Caribbean Latin America & Caribbean (excluding high income)Latin America & the Caribbean (IDA & IBRD countries)LatviaLeast developed countries: UN classificationLebanonLesothoLiberiaLibyaLithuaniaLow & middle incomeLow incomeLower middle incomeLuxembourgMacao SAR, ChinaMacedonia, FYRMadagascarMalawiMalaysiaMaldivesMaliMaltaMarshall IslandsMauritaniaMauritiusMexicoMicronesia, Fed. Sts.Middle East & North AfricaMiddle East & North Africa (excluding high income)Middle East & North Africa (IDA & IBRD countries)Middle incomeMoldovaMonacoMongoliaMontenegroMoroccoMozambiqueMyanmarNamibiaNauruNepalNetherlandsNew ZealandNicaraguaNigerNigeriaNorth AmericaNorwayOECD membersOmanPacific island small statesPakistanPalauPanamaPapua New GuineaParaguayPeruPhilippinesPolandPortugalPost-demographic dividendPre-demographic dividendPuerto RicoQatarRomaniaRussian FederationRwandaSamoaSan MarinoSao Tome and PrincipeSaudi ArabiaSenegalSerbiaSeychellesSierra LeoneSingaporeSlovak RepublicSloveniaSmall statesSolomon IslandsSomaliaSouth AfricaSouth AsiaSouth Asia (IDA & IBRD)SpainSri LankaSt. Kitts and NevisSt. LuciaSt. Vincent and the GrenadinesSub-Saharan Africa Sub-Saharan Africa (excluding high income)Sub-Saharan Africa (IDA & IBRD countries)SudanSurinameSwazilandSwedenSwitzerlandSyrian Arab RepublicTajikistanTanzaniaThailandTimor-LesteTogoTongaTrinidad and TobagoTunisiaTurkeyTurkmenistanTuvaluUgandaUkraineUnited Arab EmiratesUnited KingdomUnited StatesUpper middle incomeUruguayUzbekistanVanuatuVenezuela, RBVietnamVirgin Islands (U.S.)West Bank and GazaWorldYemen, Rep.ZambiaZimbabwe Timeline:
This timeline shows a graph from 1961 to 2012 of Bulgaria. No data until 1960. Number of actual observations by date: 31.
Source name:
World Development Indicators
Source organization:
Data are from the World Health Organization, supplemented by country data.
Categories, topics:
Health
Last updated:
apr 23, 2017
Indicators value changes by year
Maximum:
10.494
jan 1, 1994
At the date of observation
Value
Absolute change
Change from previous value
jan 1, 1961
6.214
+6.214
0.0%
jan 1, 1981
8.851
+2.637
42.44%
jan 1, 1982
8.859
+0.008
0.09%
jan 1, 1983
8.887
+0.028
0.31%
jan 1, 1984
8.877
-0.01
-0.11%
jan 1, 1985
8.963
+0.086
0.97%
jan 1, 1986
9.114
+0.151
1.68%
jan 1, 1987
9.452
+0.338
3.71%
jan 1, 1988
9.564
+0.112
1.19%
jan 1, 1989
9.56
-0.004
-0.04%
jan 1, 1990
9.702
+0.142
1.48%
jan 1, 1991
9.791
+0.089
0.91%
jan 1, 1992
9.768
-0.023
-0.23%
jan 1, 1993
10.206
+0.438
4.49%
jan 1, 1994
10.494
+0.288
2.82%
jan 1, 1995
10.196
-0.298
-2.84%
jan 1, 1996
10.37
+0.174
1.71%
jan 1, 1997
10.47
+0.1
0.96%
jan 1, 1998
10.28
-0.19
-1.81%
jan 1, 1999
8.41
-1.87
-18.19%
jan 1, 2000
7.49
-0.92
-10.94%
jan 1, 2001
7.41
-0.08
-1.07%
jan 1, 2002
7.2
-0.21
-2.83%
jan 1, 2004
6.3
-0.9
-12.5%
jan 1, 2006
6.4
+0.1
1.59%
jan 1, 2007
6.2
-0.2
-3.13%
jan 1, 2008
6.401
+0.201
3.24%
jan 1, 2009
6.5
+0.099
1.55%
jan 1, 2010
6.6
+0.1
1.54%
jan 1, 2011
6.5
-0.1
-1.52%
jan 1, 2012
6.4
-0.1
-1.54%
Ranking of countries by current statistics by years


Comments: