29
/
en
AIzaSyAYiBZKx7MnpbEhh9jyipgxe19OcubqV5w
April 1, 2024
93520
Bulgaria
BGR
true
2
1
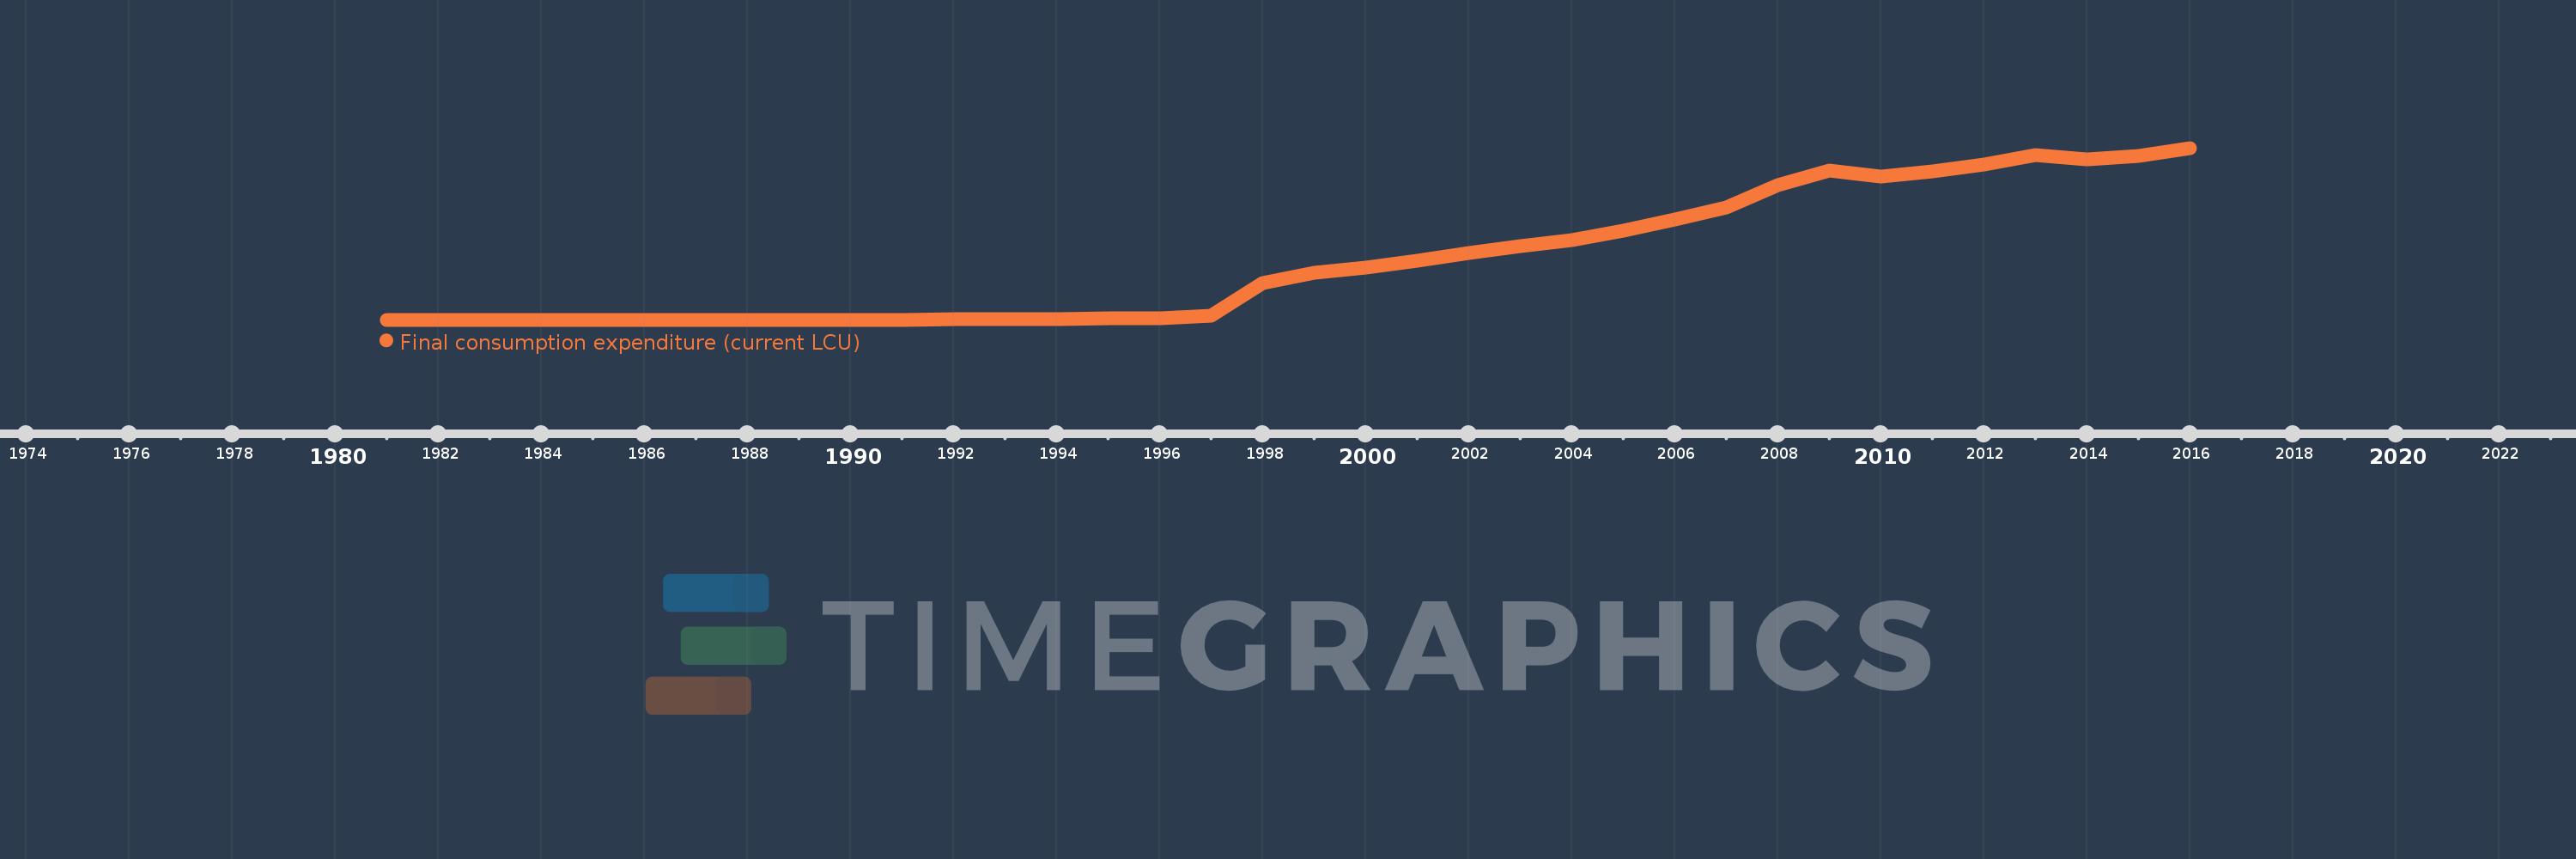
Final consumption expenditure (current LCU)
2016,2015,2014,2013,2012,2011,2010,2009,2008,2007,2006,2005,2004,2003,2002,2001,2000,1999,1998,1997,1996,1995,1994,1993,1992,1991,1990,1989,1988,1987,1986,1985,1984,1983,1982,1981
This statistics in other country:
AfghanistanAlbaniaAlgeriaAngolaAntigua and BarbudaArgentinaArmeniaArubaAustraliaAustriaAzerbaijanBahamas, TheBahrainBangladeshBarbadosBelarusBelgiumBelizeBeninBermudaBhutanBoliviaBosnia and HerzegovinaBotswanaBrazilBrunei DarussalamBulgariaBurkina FasoBurundiCabo VerdeCambodiaCameroonCanadaCentral African RepublicChadChileChinaColombiaComorosCongo, Dem. Rep.Congo, Rep.Costa RicaCote d'IvoireCroatiaCubaCyprusCzech RepublicDenmarkDjiboutiDominicaDominican RepublicEcuadorEgypt, Arab Rep.El SalvadorEquatorial GuineaEritreaEstoniaEthiopiaFaroe IslandsFijiFinlandFranceGabonGambia, TheGeorgiaGermanyGhanaGreeceGrenadaGuatemalaGuineaGuinea-BissauGuyanaHaitiHondurasHong Kong SAR, ChinaHungaryIcelandIndiaIndonesiaIran, Islamic Rep.IrelandIsraelItalyJamaicaJapanJordanKazakhstanKenyaKiribatiKorea, Rep.KosovoKuwaitKyrgyz RepublicLao PDRLatviaLebanonLesothoLiberiaLibyaLithuaniaLuxembourgMacao SAR, ChinaMacedonia, FYRMadagascarMalawiMalaysiaMaliMaltaMauritaniaMauritiusMexicoMicronesia, Fed. Sts.MoldovaMongoliaMontenegroMoroccoMozambiqueNamibiaNepalNetherlandsNew CaledoniaNew ZealandNicaraguaNigerNigeriaNorwayOmanPakistanPanamaPapua New GuineaParaguayPeruPhilippinesPolandPortugalPuerto RicoQatarRomaniaRussian FederationRwandaSaudi ArabiaSenegalSerbiaSeychellesSierra LeoneSingaporeSlovak RepublicSloveniaSolomon IslandsSomaliaSouth AfricaSouth SudanSpainSri LankaSt. Kitts and NevisSt. LuciaSt. Vincent and the GrenadinesSudanSurinameSwazilandSwedenSwitzerlandSyrian Arab RepublicTajikistanTanzaniaThailandTimor-LesteTogoTongaTrinidad and TobagoTunisiaTurkeyUgandaUkraineUnited Arab EmiratesUnited KingdomUnited StatesUruguayUzbekistanVanuatuVenezuela, RBVietnamWest Bank and GazaYemen, Rep.ZambiaZimbabwe Timeline:
This timeline shows a graph from 1981 to 2016 of Bulgaria. No data until 1980. Number of actual observations by date: 36.
Source name:
World Development Indicators
Source organization:
World Bank national accounts data, and OECD National Accounts data files.
Categories, topics:
Economy & Growth
Last updated:
apr 23, 2017
Indicators value changes by year
Minimum:
17.636 mln
jan 1, 1982
Maximum:
69.672 bln
jan 1, 2016
At the date of observation
Value
Absolute change
Change from previous value
jan 1, 1981
17.804 mln
+17.804 mln
0.0%
jan 1, 1982
17.636 mln
-168.8K
-0.95%
jan 1, 1983
18.802 mln
+1.166 mln
6.61%
jan 1, 1984
19.802 mln
+1.001 mln
5.32%
jan 1, 1985
20.558 mln
+755.9K
3.82%
jan 1, 1986
22.233 mln
+1.675 mln
8.15%
jan 1, 1987
23.257 mln
+1.024 mln
4.6%
jan 1, 1988
25.182 mln
+1.925 mln
8.28%
jan 1, 1989
25.274 mln
+92.2K
0.37%
jan 1, 1990
27.163 mln
+1.888 mln
7.47%
jan 1, 1991
35.414 mln
+8.251 mln
30.38%
jan 1, 1992
99.254 mln
+63.84 mln
180.27%
jan 1, 1993
172.59 mln
+73.336 mln
73.89%
jan 1, 1994
276.022 mln
+103.432 mln
59.93%
jan 1, 1995
479.477 mln
+203.455 mln
73.71%
jan 1, 1996
722.362 mln
+242.885 mln
50.66%
jan 1, 1997
1.549 bln
+826.353 mln
114.4%
jan 1, 1998
14.745 bln
+13.196 bln
852.08%
jan 1, 1999
19.184 bln
+4.439 bln
30.1%
jan 1, 2000
21.152 bln
+1.968 bln
10.26%
jan 1, 2001
24.051 bln
+2.899 bln
13.71%
jan 1, 2002
27.162 bln
+3.111 bln
12.94%
jan 1, 2003
29.711 bln
+2.549 bln
9.39%
jan 1, 2004
32.158 bln
+2.446 bln
8.23%
jan 1, 2005
36.045 bln
+3.887 bln
12.09%
jan 1, 2006
40.8 bln
+4.755 bln
13.19%
jan 1, 2007
45.457 bln
+4.656 bln
11.41%
jan 1, 2008
54.579 bln
+9.123 bln
20.07%
jan 1, 2009
60.569 bln
+5.99 bln
10.97%
jan 1, 2010
58.034 bln
-2.535 bln
-4.19%
jan 1, 2011
60.028 bln
+1.993 bln
3.43%
jan 1, 2012
63.116 bln
+3.088 bln
5.14%
jan 1, 2013
66.642 bln
+3.526 bln
5.59%
jan 1, 2014
64.969 bln
-1.673 bln
-2.51%
jan 1, 2015
66.496 bln
+1.527 bln
2.35%
jan 1, 2016
69.672 bln
+3.177 bln
4.78%
Ranking of countries by current statistics by years


Comments: