29
/
en
AIzaSyAYiBZKx7MnpbEhh9jyipgxe19OcubqV5w
April 1, 2024
91385
Brazil
BRA
true
2
1
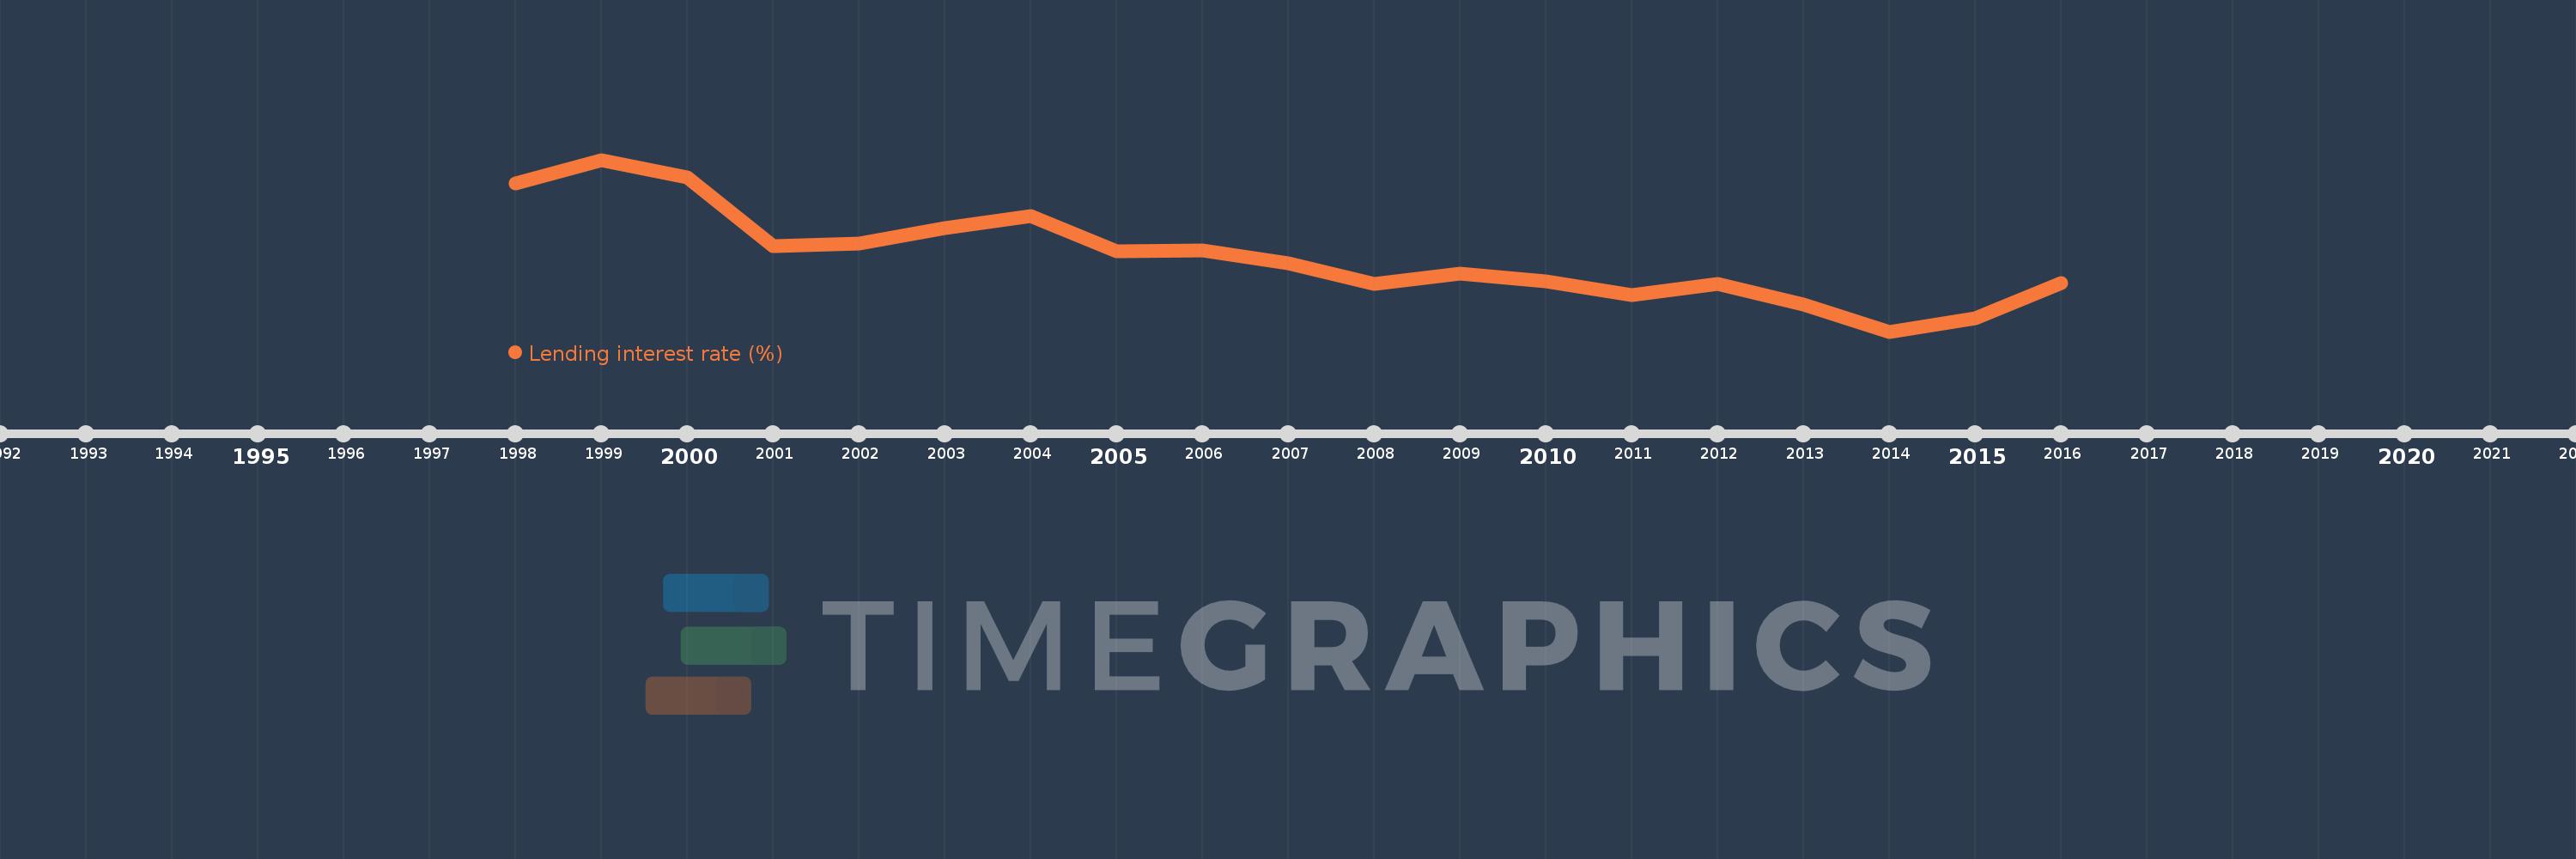
Lending interest rate (%)
2016,2015,2014,2013,2012,2011,2010,2009,2008,2007,2006,2005,2004,2003,2002,2001,2000,1999,1998
This statistics in other country:
AfghanistanAlbaniaAlgeriaAngolaAntigua and BarbudaArgentinaArmeniaArubaAustraliaAustriaAzerbaijanBahamas, TheBahrainBangladeshBarbadosBelarusBelgiumBelizeBeninBhutanBoliviaBosnia and HerzegovinaBotswanaBrazilBrunei DarussalamBulgariaBurkina FasoBurundiCabo VerdeCameroonCanadaCentral African RepublicChadChileChinaColombiaComorosCongo, Dem. Rep.Congo, Rep.Costa RicaCote d'IvoireCroatiaCyprusCzech RepublicDenmarkDjiboutiDominicaDominican RepublicEcuadorEgypt, Arab Rep.Equatorial GuineaEstoniaEthiopiaEuro areaFijiFinlandFranceGabonGambia, TheGeorgiaGermanyGhanaGreeceGrenadaGuatemalaGuineaGuinea-BissauGuyanaHaitiHondurasHong Kong SAR, ChinaHungaryIcelandIndiaIndonesiaIran, Islamic Rep.IraqIrelandIsraelItalyJamaicaJapanJordanKenyaKorea, Rep.KosovoKuwaitKyrgyz RepublicLao PDRLatviaLebanonLesothoLiberiaLibyaLithuaniaLuxembourgMacao SAR, ChinaMacedonia, FYRMadagascarMalawiMalaysiaMaldivesMaliMaltaMauritaniaMauritiusMexicoMicronesia, Fed. Sts.MoldovaMongoliaMontenegroMoroccoMozambiqueMyanmarNamibiaNepalNetherlandsNew ZealandNicaraguaNigerNigeriaNorwayOmanPanamaPapua New GuineaParaguayPeruPhilippinesPolandPortugalQatarRomaniaRussian FederationRwandaSamoaSan MarinoSao Tome and PrincipeSenegalSerbiaSeychellesSierra LeoneSingaporeSlovak RepublicSloveniaSolomon IslandsSouth AfricaSouth SudanSpainSri LankaSt. Kitts and NevisSt. LuciaSt. Vincent and the GrenadinesSurinameSwazilandSwedenSwitzerlandSyrian Arab RepublicTajikistanTanzaniaThailandTimor-LesteTogoTongaTrinidad and TobagoTunisiaUgandaUkraineUnited KingdomUnited StatesUruguayVanuatuVenezuela, RBVietnamWest Bank and GazaYemen, Rep.ZambiaZimbabwe Timeline:
This timeline shows a graph from 1998 to 2016 of Brazil. No data until 1997. Number of actual observations by date: 19.
Source name:
World Development Indicators
Source organization:
International Monetary Fund, International Financial Statistics and data files.
Categories, topics:
Financial Sector
Last updated:
apr 23, 2017
Indicators value changes by year
Minimum:
27.392
jan 1, 2014
Maximum:
86.363
jan 1, 1999
At the date of observation
Value
Absolute change
Change from previous value
jan 1, 1998
78.193
+78.193
0.0%
jan 1, 1999
86.363
+8.17
10.45%
jan 1, 2000
80.443
-5.92
-6.85%
jan 1, 2001
56.83
-23.613
-29.35%
jan 1, 2002
57.617
+0.787
1.38%
jan 1, 2003
62.875
+5.258
9.13%
jan 1, 2004
67.083
+4.208
6.69%
jan 1, 2005
54.925
-12.158
-18.12%
jan 1, 2006
55.383
+0.458
0.83%
jan 1, 2007
50.808
-4.575
-8.26%
jan 1, 2008
43.717
-7.092
-13.96%
jan 1, 2009
47.25
+3.533
8.08%
jan 1, 2010
44.65
-2.6
-5.5%
jan 1, 2011
39.992
-4.658
-10.43%
jan 1, 2012
43.883
+3.892
9.73%
jan 1, 2013
36.637
-7.247
-16.51%
jan 1, 2014
27.392
-9.245
-25.23%
jan 1, 2015
32.008
+4.617
16.85%
jan 1, 2016
43.958
+11.95
37.33%
Ranking of countries by current statistics by years


Comments: