29
/
en
AIzaSyAYiBZKx7MnpbEhh9jyipgxe19OcubqV5w
April 1, 2024
91164
Brazil
BRA
true
2
1
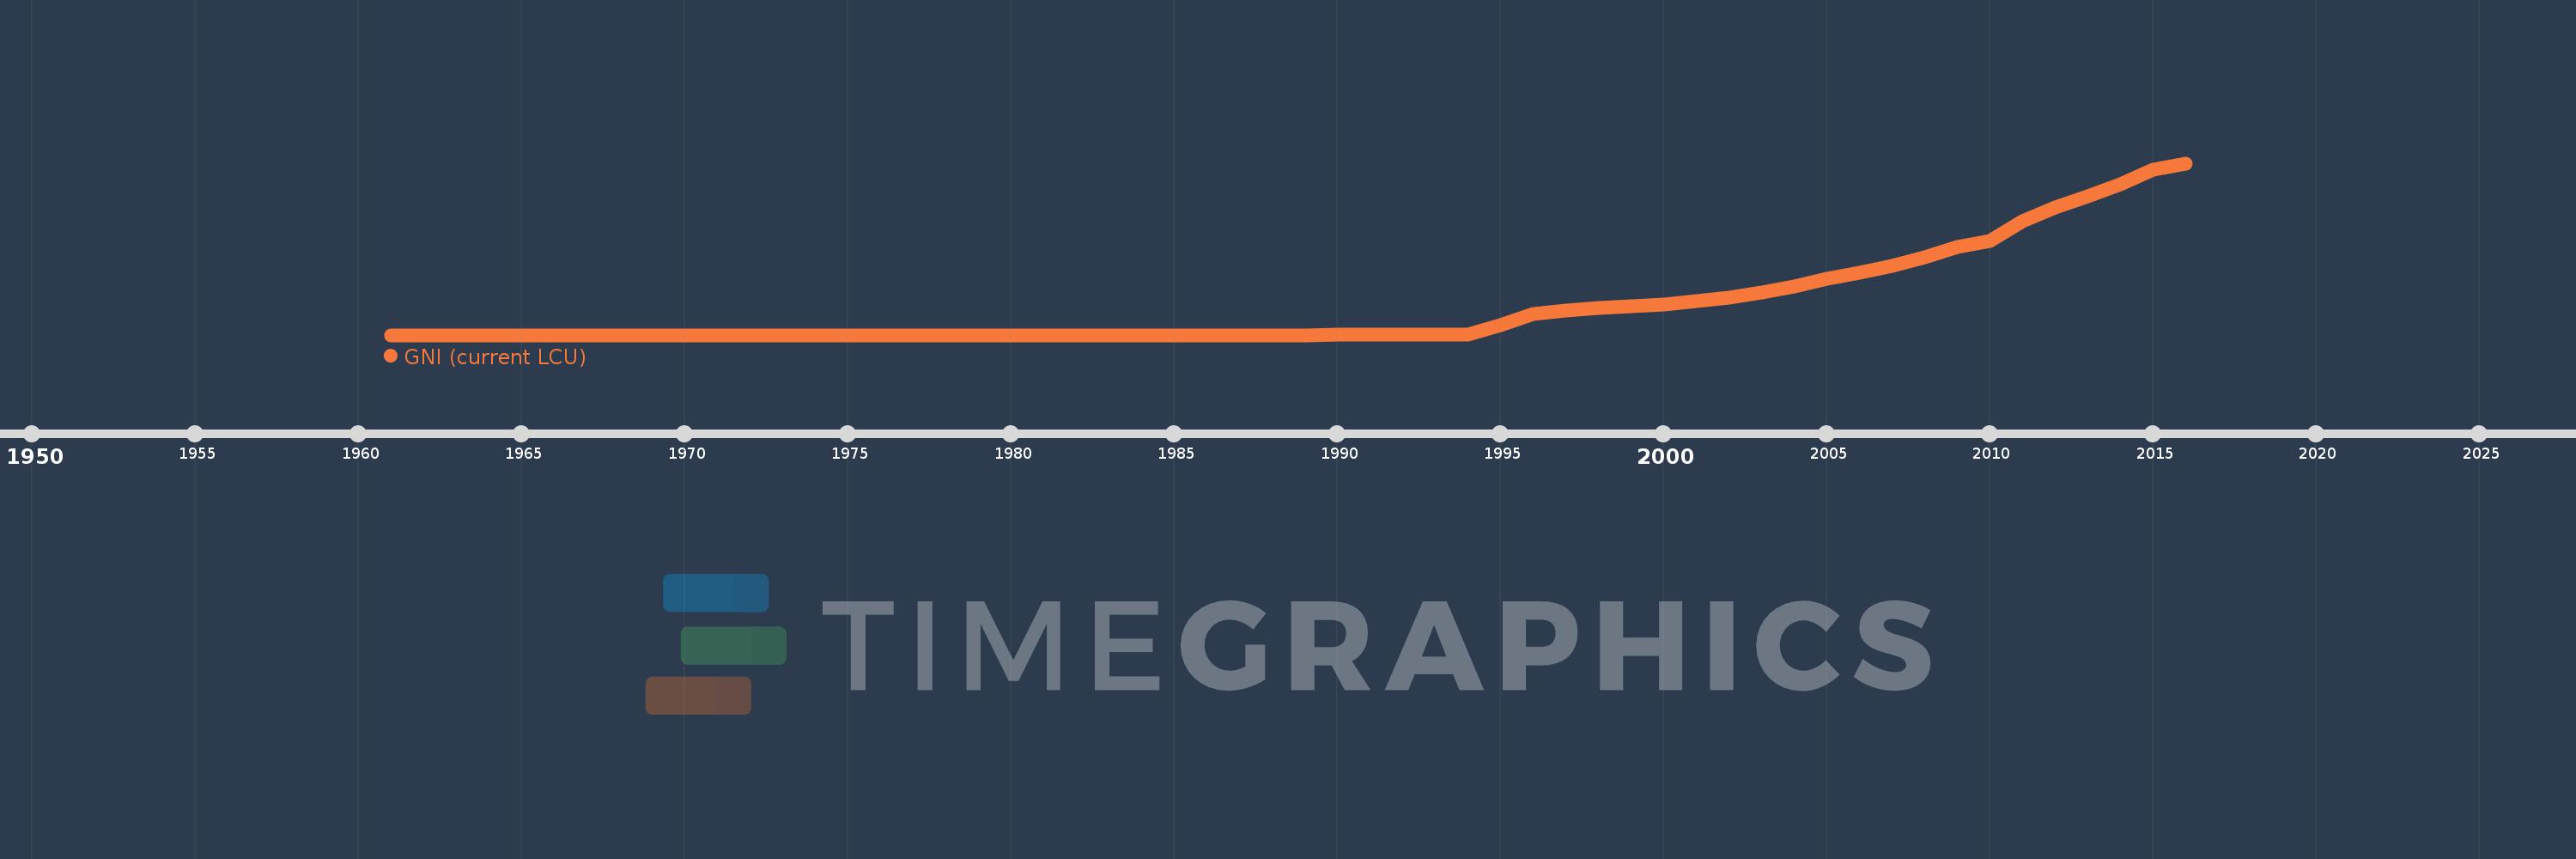
GNI (current LCU)
2016,2015,2014,2013,2012,2011,2010,2009,2008,2007,2006,2005,2004,2003,2002,2001,2000,1999,1998,1997,1996,1995,1994,1993,1992,1991,1990,1989,1988,1987,1986,1985,1984,1983,1982,1981,1980,1979,1978,1977,1976,1975,1974,1973,1972,1971,1970,1969,1968,1967,1966,1965,1964,1963,1962,1961
This statistics in other country:
AfghanistanAlbaniaAlgeriaAmerican SamoaAndorraAngolaAntigua and BarbudaArgentinaArmeniaAustraliaAustriaAzerbaijanBahamas, TheBahrainBangladeshBarbadosBelarusBelgiumBelizeBeninBermudaBhutanBoliviaBosnia and HerzegovinaBotswanaBrazilBrunei DarussalamBulgariaBurkina FasoBurundiCabo VerdeCambodiaCameroonCanadaCentral African RepublicChadChannel IslandsChileChinaColombiaComorosCongo, Dem. Rep.Congo, Rep.Costa RicaCote d'IvoireCroatiaCubaCyprusCzech RepublicDenmarkDjiboutiDominicaDominican RepublicEcuadorEgypt, Arab Rep.El SalvadorEquatorial GuineaEritreaEstoniaEthiopiaFaroe IslandsFijiFinlandFranceFrench PolynesiaGabonGambia, TheGeorgiaGermanyGhanaGreeceGreenlandGrenadaGuamGuatemalaGuineaGuinea-BissauGuyanaHaitiHondurasHong Kong SAR, ChinaHungaryIcelandIndiaIndonesiaIran, Islamic Rep.IraqIrelandIsle of ManIsraelItalyJamaicaJapanJordanKazakhstanKenyaKiribatiKorea, Rep.KosovoKuwaitKyrgyz RepublicLao PDRLatviaLebanonLesothoLiberiaLibyaLiechtensteinLithuaniaLuxembourgMacao SAR, ChinaMacedonia, FYRMadagascarMalawiMalaysiaMaldivesMaliMaltaMarshall IslandsMauritaniaMauritiusMexicoMicronesia, Fed. Sts.MoldovaMonacoMongoliaMontenegroMoroccoMozambiqueMyanmarNamibiaNauruNepalNetherlandsNew CaledoniaNew ZealandNicaraguaNigerNigeriaNorwayOmanPakistanPalauPanamaPapua New GuineaParaguayPeruPhilippinesPolandPortugalPuerto RicoQatarRomaniaRussian FederationRwandaSamoaSan MarinoSao Tome and PrincipeSaudi ArabiaSenegalSerbiaSeychellesSierra LeoneSingaporeSlovak RepublicSloveniaSolomon IslandsSomaliaSouth AfricaSouth SudanSpainSri LankaSt. Kitts and NevisSt. LuciaSt. Vincent and the GrenadinesSudanSurinameSwazilandSwedenSwitzerlandSyrian Arab RepublicTajikistanTanzaniaThailandTimor-LesteTogoTongaTrinidad and TobagoTunisiaTurkeyTurkmenistanTuvaluUgandaUkraineUnited Arab EmiratesUnited KingdomUnited StatesUruguayUzbekistanVanuatuVenezuela, RBVietnamVirgin Islands (U.S.)West Bank and GazaYemen, Rep.ZambiaZimbabwe Timeline:
This timeline shows a graph from 1961 to 2016 of Brazil. No data until 1960. Number of actual observations by date: 56.
Source name:
World Development Indicators
Source organization:
World Bank national accounts data, and OECD National Accounts data files.
Categories, topics:
Economy & Growth
Last updated:
apr 23, 2017
Indicators value changes by year
Maximum:
5.775 trl
jan 1, 2016
At the date of observation
Value
Absolute change
Change from previous value
jan 1, 1961
0.001
+0.001
0.0%
jan 1, 1962
0.001
+0.0
44.8%
jan 1, 1963
0.003
+0.001
88.16%
jan 1, 1964
0.005
+0.002
71.25%
jan 1, 1965
0.01
+0.005
100.59%
jan 1, 1966
0.015
+0.005
56.01%
jan 1, 1967
0.021
+0.006
38.55%
jan 1, 1968
0.029
+0.008
37.31%
jan 1, 1969
0.041
+0.012
42.58%
jan 1, 1970
0.054
+0.014
33.49%
jan 1, 1971
0.07
+0.015
27.86%
jan 1, 1972
0.094
+0.024
34.32%
jan 1, 1973
0.125
+0.032
33.86%
jan 1, 1974
0.175
+0.049
39.33%
jan 1, 1975
0.257
+0.083
47.53%
jan 1, 1976
0.36
+0.103
39.99%
jan 1, 1977
0.583
+0.223
61.83%
jan 1, 1978
0.891
+0.307
52.7%
jan 1, 1979
1.288
+0.397
44.59%
jan 1, 1980
2.144
+0.856
66.51%
jan 1, 1981
4.355
+2.211
103.09%
jan 1, 1982
8.552
+4.197
96.37%
jan 1, 1983
17.436
+8.884
103.88%
jan 1, 1984
40.152
+22.717
130.29%
jan 1, 1985
132.418
+92.266
229.79%
jan 1, 1986
475.949
+343.531
259.43%
jan 1, 1987
1.272K
+796.21
167.29%
jan 1, 1988
4.036K
+2.764K
217.28%
jan 1, 1989
30.218K
+26.182K
648.65%
jan 1, 1990
448.509K
+418.291K
1.38K%
jan 1, 1991
11.242 mln
+10.793 mln
2.41K%
jan 1, 1992
58.935 mln
+47.693 mln
424.25%
jan 1, 1993
628.868 mln
+569.933 mln
967.05%
jan 1, 1994
13.754 bln
+13.125 bln
2.09K%
jan 1, 1995
343.381 bln
+329.627 bln
2.4K%
jan 1, 1996
695.487 bln
+352.107 bln
102.54%
jan 1, 1997
831.737 bln
+136.25 bln
19.59%
jan 1, 1998
921.711 bln
+89.974 bln
10.82%
jan 1, 1999
958.035 bln
+36.324 bln
3.94%
jan 1, 2000
1.031 trl
+72.857 bln
7.6%
jan 1, 2001
1.147 trl
+116.001 bln
11.25%
jan 1, 2002
1.257 trl
+109.74 bln
9.57%
jan 1, 2003
1.426 trl
+169.251 bln
13.47%
jan 1, 2004
1.645 trl
+218.922 bln
15.35%
jan 1, 2005
1.883 trl
+238.213 bln
14.48%
jan 1, 2006
2.086 trl
+202.635 bln
10.76%
jan 1, 2007
2.311 trl
+225.245 bln
10.8%
jan 1, 2008
2.607 trl
+295.635 bln
12.79%
jan 1, 2009
2.96 trl
+353.896 bln
13.58%
jan 1, 2010
3.175 trl
+214.896 bln
7.26%
jan 1, 2011
3.822 trl
+647.006 bln
20.38%
jan 1, 2012
4.301 trl
+478.442 bln
12.52%
jan 1, 2013
4.649 trl
+348.652 bln
8.11%
jan 1, 2014
5.08 trl
+430.405 bln
9.26%
jan 1, 2015
5.573 trl
+493.155 bln
9.71%
jan 1, 2016
5.775 trl
+202.426 bln
3.63%
Ranking of countries by current statistics by years


Comments: