29
/
en
AIzaSyAYiBZKx7MnpbEhh9jyipgxe19OcubqV5w
April 1, 2024
90852
Brazil
BRA
true
2
1
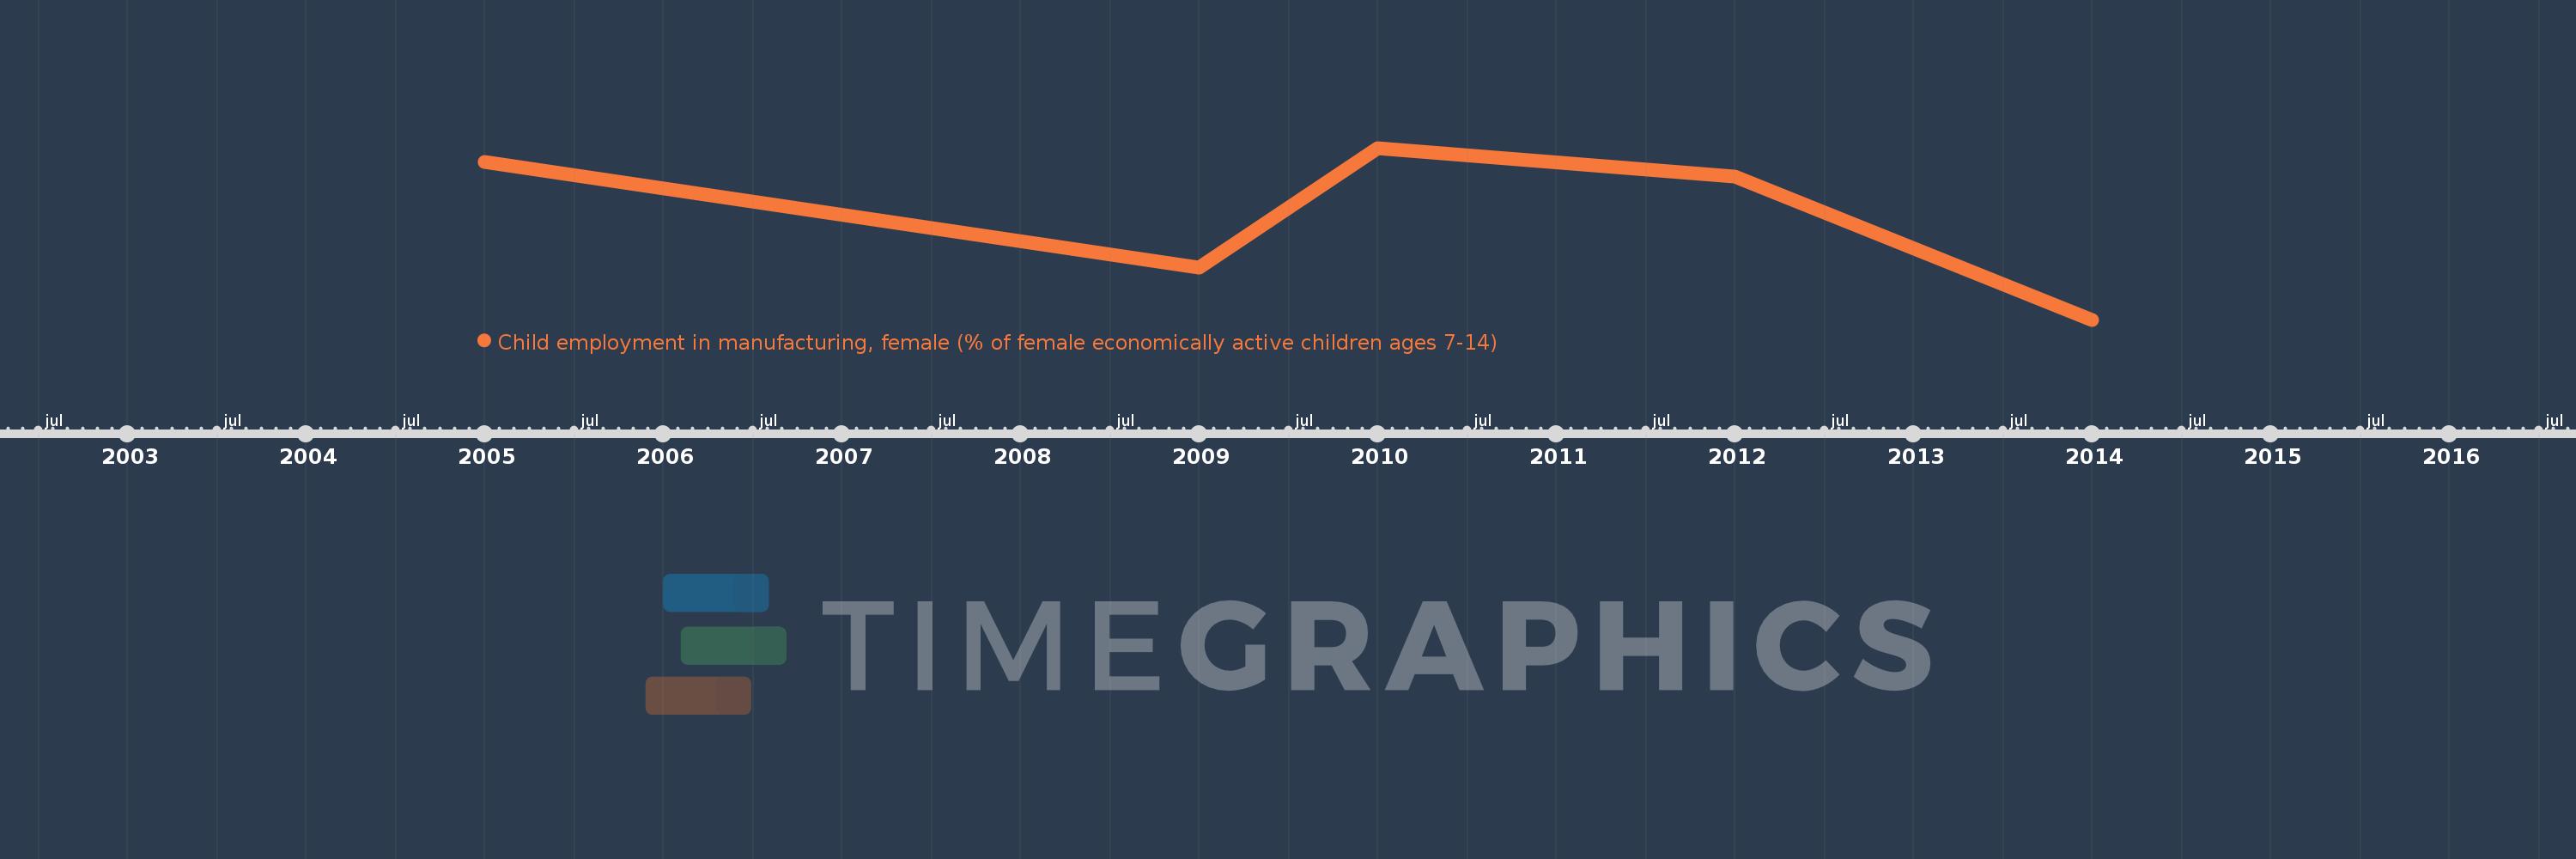
Child employment in manufacturing, female (% of female economically active children ages 7-14)
2014,2012,2010,2009,2005
This statistics in other country:
Timeline:
This timeline shows a graph from 2005 to 2014 of Brazil. No data until 2004. Number of actual observations by date: 5.
Source name:
World Development Indicators
Source organization:
Understanding Children's Work project based on data from ILO, UNICEF and the World Bank.
Categories, topics:
Social Protection & Labor, Gender
Last updated:
apr 23, 2017
Indicators value changes by year
At the date of observation
Value
Absolute change
Change from previous value
jan 1, 2009
8.6
-1.1
-11.34%
jan 1, 2010
9.85
+1.25
14.53%
jan 1, 2012
9.55
-0.3
-3.05%
jan 1, 2014
8.06
-1.49
-15.6%
Ranking of countries by current statistics by years


Comments: