29
/
en
AIzaSyAYiBZKx7MnpbEhh9jyipgxe19OcubqV5w
April 1, 2024
90583
Botswana
BWA
true
2
1
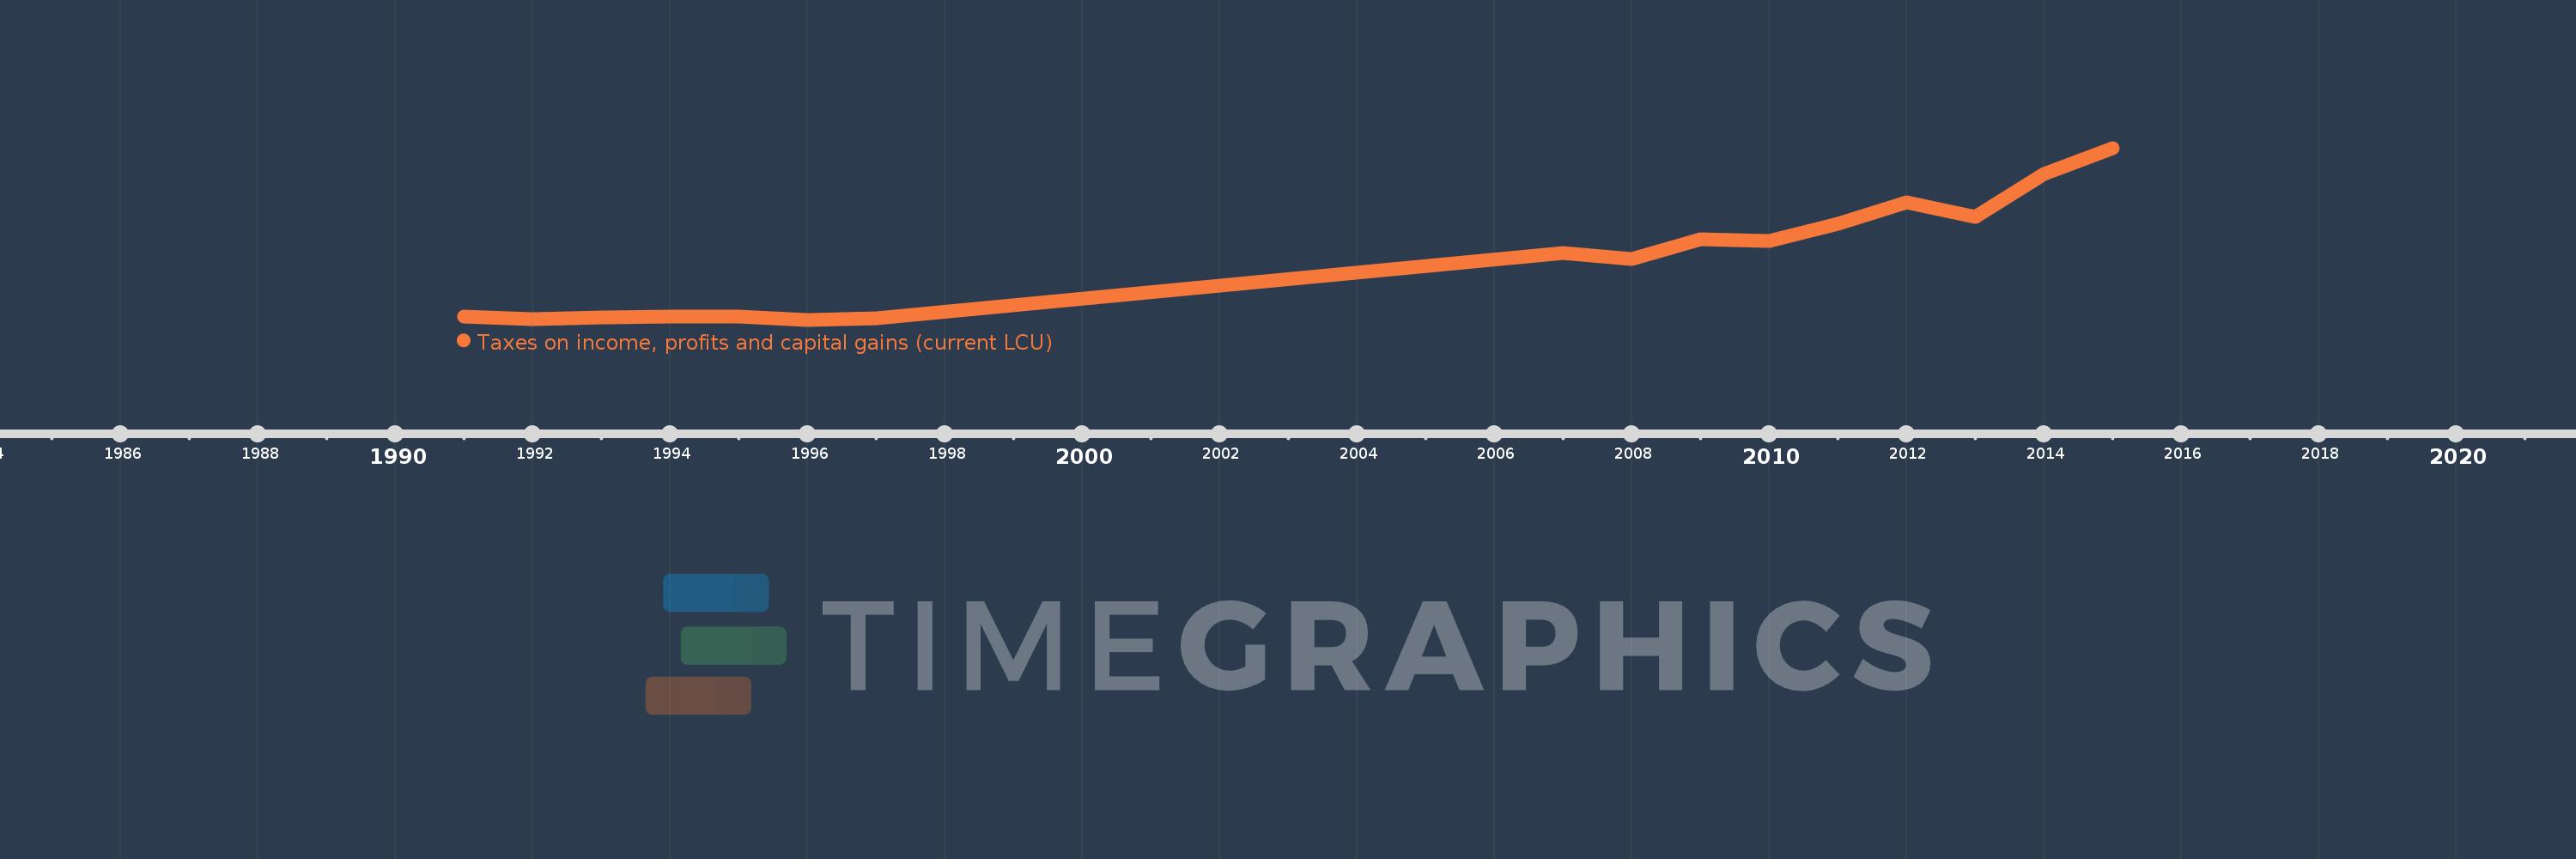
Taxes on income, profits and capital gains (current LCU)
2015,2014,2013,2012,2011,2010,2009,2008,2007,1997,1996,1995,1994,1993,1992,1991
This statistics in other country:
AfghanistanAlbaniaAlgeriaAngolaAntigua and BarbudaArgentinaArmeniaAustraliaAustriaAzerbaijanBahrainBangladeshBarbadosBelarusBelgiumBelizeBeninBhutanBoliviaBosnia and HerzegovinaBotswanaBrazilBulgariaBurkina FasoBurundiCabo VerdeCambodiaCanadaCentral African RepublicChileChinaColombiaCongo, Dem. Rep.Congo, Rep.Costa RicaCote d'IvoireCroatiaCyprusCzech RepublicDenmarkDominicaDominican RepublicEgypt, Arab Rep.El SalvadorEquatorial GuineaEstoniaEthiopiaFijiFinlandFranceGambia, TheGeorgiaGermanyGhanaGreeceGrenadaGuatemalaHondurasHong Kong SAR, ChinaHungaryIcelandIndiaIndonesiaIran, Islamic Rep.IraqIrelandIsraelItalyJamaicaJapanJordanKazakhstanKenyaKiribatiKorea, Rep.KuwaitKyrgyz RepublicLao PDRLatviaLebanonLesothoLiberiaLithuaniaLuxembourgMacao SAR, ChinaMacedonia, FYRMadagascarMalawiMalaysiaMaldivesMaliMaltaMauritiusMexicoMicronesia, Fed. Sts.MoldovaMongoliaMoroccoMozambiqueMyanmarNamibiaNepalNetherlandsNew ZealandNicaraguaNigeriaNorwayOmanPakistanPanamaPapua New GuineaParaguayPeruPhilippinesPolandPortugalQatarRomaniaRussian FederationRwandaSamoaSan MarinoSao Tome and PrincipeSenegalSerbiaSeychellesSierra LeoneSingaporeSlovak RepublicSloveniaSolomon IslandsSouth AfricaSpainSri LankaSt. Kitts and NevisSt. LuciaSurinameSwazilandSwedenSwitzerlandSyrian Arab RepublicTajikistanTanzaniaThailandTimor-LesteTogoTrinidad and TobagoTunisiaTurkeyUgandaUkraineUnited KingdomUnited StatesUruguayVenezuela, RBVietnamWest Bank and GazaYemen, Rep.ZambiaZimbabwe Timeline:
This timeline shows a graph from 1991 to 2015 of Botswana. No data until 1990. Number of actual observations by date: 16.
Source name:
World Development Indicators
Source organization:
International Monetary Fund, Government Finance Statistics Yearbook and data files.
Categories, topics:
Public Sector
Last updated:
apr 23, 2017
Indicators value changes by year
Minimum:
1.127 bln
jan 1, 1996
Maximum:
15.882 bln
jan 1, 2015
At the date of observation
Value
Absolute change
Change from previous value
jan 1, 1991
1.391 bln
+1.391 bln
0.0%
jan 1, 1992
1.191 bln
-199.9 mln
-14.37%
jan 1, 1993
1.298 bln
+106.6 mln
8.95%
jan 1, 1994
1.415 bln
+117.8 mln
9.08%
jan 1, 1995
1.381 bln
-34.2 mln
-2.42%
jan 1, 1996
1.127 bln
-254.0 mln
-18.39%
jan 1, 1997
1.234 bln
+106.7 mln
9.47%
jan 1, 2007
6.875 bln
+5.641 bln
457.23%
jan 1, 2008
6.342 bln
-532.98 mln
-7.75%
jan 1, 2009
8.06 bln
+1.718 bln
27.08%
jan 1, 2010
7.92 bln
-139.57 mln
-1.73%
jan 1, 2011
9.362 bln
+1.442 bln
18.21%
jan 1, 2012
11.249 bln
+1.887 bln
20.15%
jan 1, 2013
9.987 bln
-1.262 bln
-11.22%
jan 1, 2014
13.661 bln
+3.674 bln
36.79%
jan 1, 2015
15.882 bln
+2.221 bln
16.26%
Ranking of countries by current statistics by years


Comments: