29
/
en
AIzaSyAYiBZKx7MnpbEhh9jyipgxe19OcubqV5w
April 1, 2024
90283
Botswana
BWA
true
2
1
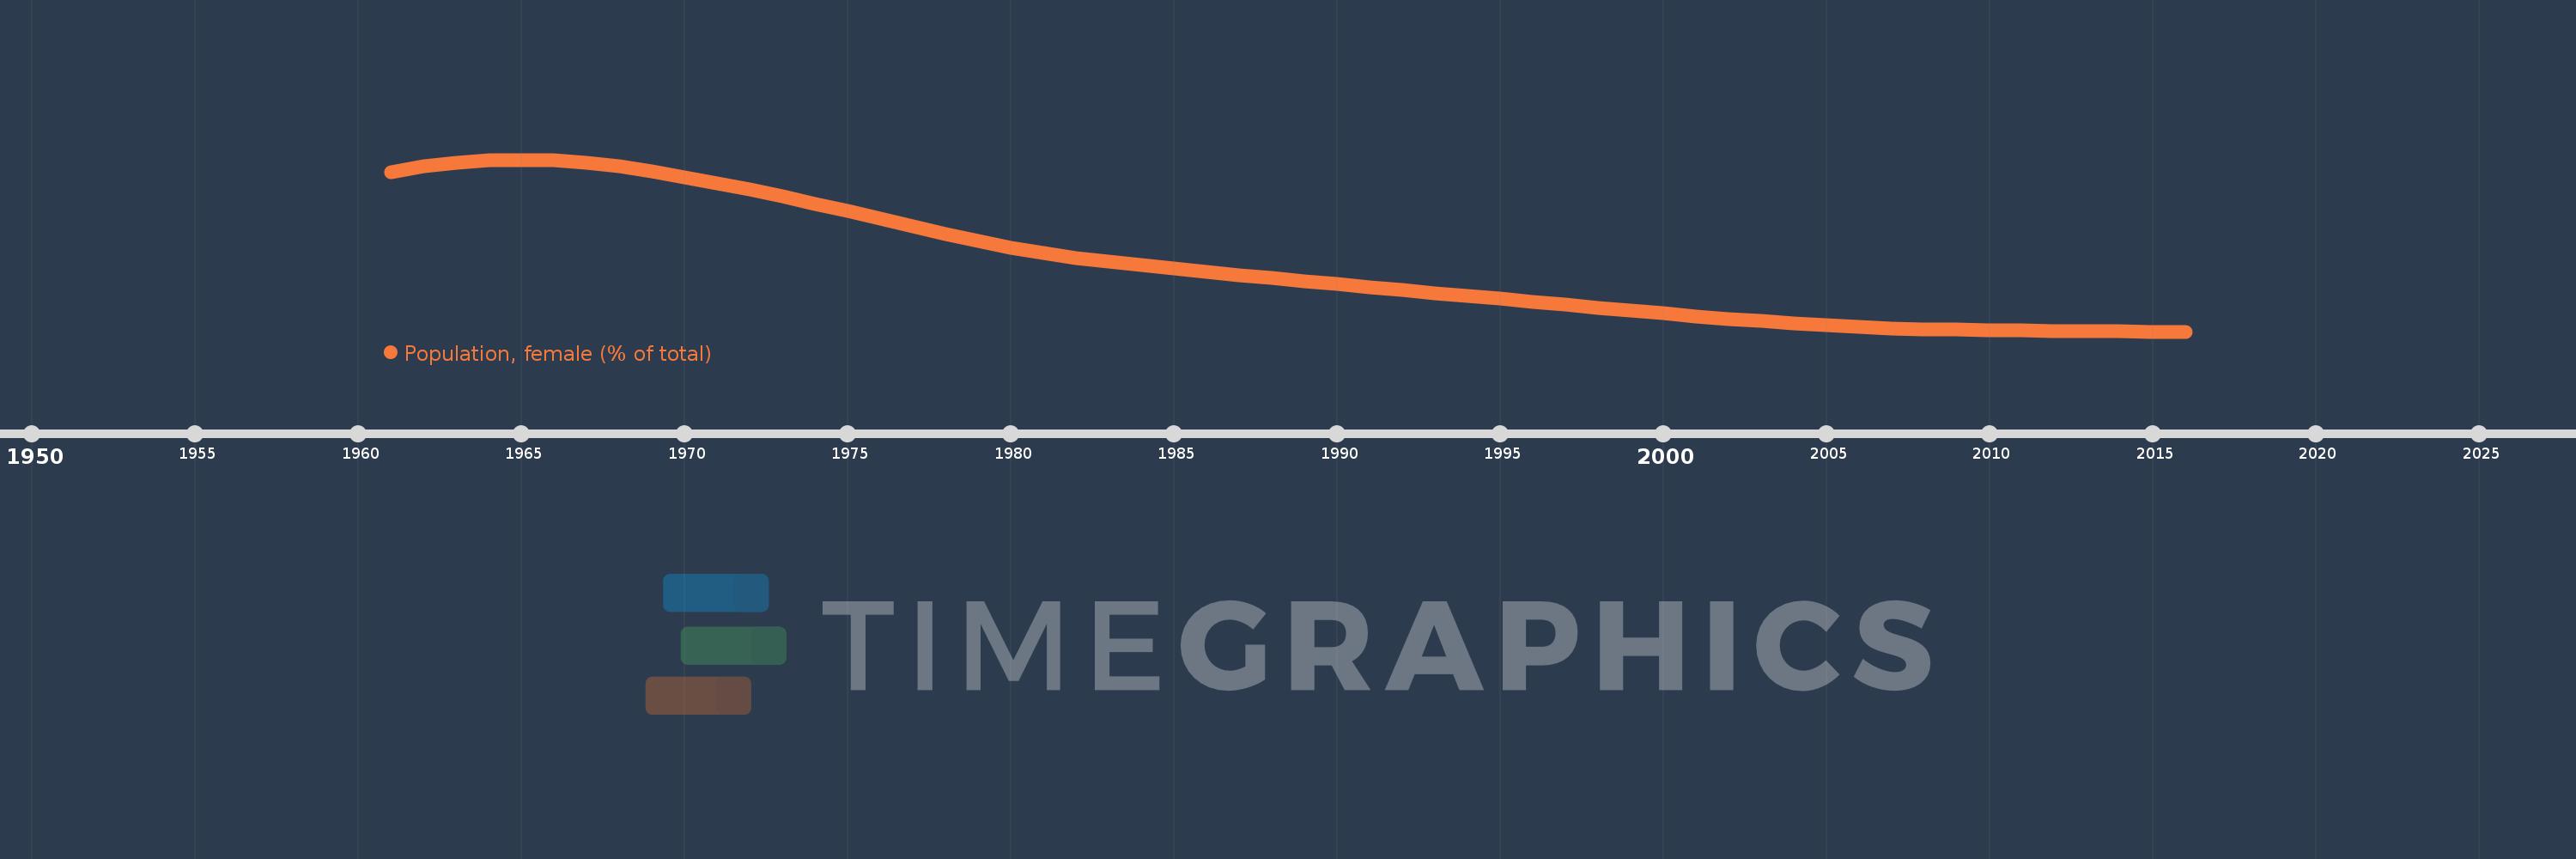
Population, female (% of total)
2016,2015,2014,2013,2012,2011,2010,2009,2008,2007,2006,2005,2004,2003,2002,2001,2000,1999,1998,1997,1996,1995,1994,1993,1992,1991,1990,1989,1988,1987,1986,1985,1984,1983,1982,1981,1980,1979,1978,1977,1976,1975,1974,1973,1972,1971,1970,1969,1968,1967,1966,1965,1964,1963,1962,1961
This statistics in other country:
AfghanistanAlbaniaAlgeriaAngolaAntigua and BarbudaArab WorldArgentinaArmeniaArubaAustraliaAustriaAzerbaijanBahamas, TheBahrainBangladeshBarbadosBelarusBelgiumBelizeBeninBhutanBoliviaBosnia and HerzegovinaBotswanaBrazilBrunei DarussalamBulgariaBurkina FasoBurundiCabo VerdeCambodiaCameroonCanadaCaribbean small statesCentral African RepublicCentral Europe and the BalticsChadChannel IslandsChileChinaColombiaComorosCongo, Dem. Rep.Congo, Rep.Costa RicaCote d'IvoireCroatiaCubaCuracaoCyprusCzech RepublicDenmarkDjiboutiDominican RepublicEarly-demographic dividendEast Asia & PacificEast Asia & Pacific (excluding high income)East Asia & Pacific (IDA & IBRD countries)EcuadorEgypt, Arab Rep.El SalvadorEquatorial GuineaEritreaEstoniaEthiopiaEuro areaEurope & Central AsiaEurope & Central Asia (excluding high income)Europe & Central Asia (IDA & IBRD countries)European UnionFijiFinlandFragile and conflict affected situationsFranceFrench PolynesiaGabonGambia, TheGeorgiaGermanyGhanaGreeceGrenadaGuamGuatemalaGuineaGuinea-BissauGuyanaHaitiHeavily indebted poor countries (HIPC)High incomeHondurasHong Kong SAR, ChinaHungaryIBRD onlyIcelandIDA & IBRD totalIDA blendIDA onlyIDA totalIndiaIndonesiaIran, Islamic Rep.IraqIrelandIsraelItalyJamaicaJapanJordanKazakhstanKenyaKiribatiKorea, Dem. People’s Rep.Korea, Rep.KosovoKuwaitKyrgyz RepublicLao PDRLate-demographic dividendLatin America & Caribbean Latin America & Caribbean (excluding high income)Latin America & the Caribbean (IDA & IBRD countries)LatviaLeast developed countries: UN classificationLebanonLesothoLiberiaLibyaLithuaniaLow & middle incomeLow incomeLower middle incomeLuxembourgMacao SAR, ChinaMacedonia, FYRMadagascarMalawiMalaysiaMaldivesMaliMaltaMauritaniaMauritiusMexicoMicronesia, Fed. Sts.Middle East & North AfricaMiddle East & North Africa (excluding high income)Middle East & North Africa (IDA & IBRD countries)Middle incomeMoldovaMongoliaMontenegroMoroccoMozambiqueMyanmarNamibiaNepalNetherlandsNew CaledoniaNew ZealandNicaraguaNigerNigeriaNorth AmericaNorwayOECD membersOmanOther small statesPacific island small statesPakistanPanamaPapua New GuineaParaguayPeruPhilippinesPolandPortugalPost-demographic dividendPre-demographic dividendPuerto RicoQatarRomaniaRussian FederationRwandaSamoaSao Tome and PrincipeSaudi ArabiaSenegalSerbiaSeychellesSierra LeoneSingaporeSlovak RepublicSloveniaSmall statesSolomon IslandsSomaliaSouth AfricaSouth AsiaSouth Asia (IDA & IBRD)South SudanSpainSri LankaSt. LuciaSt. Vincent and the GrenadinesSub-Saharan Africa Sub-Saharan Africa (excluding high income)Sub-Saharan Africa (IDA & IBRD countries)SudanSurinameSwazilandSwedenSwitzerlandSyrian Arab RepublicTajikistanTanzaniaThailandTimor-LesteTogoTongaTrinidad and TobagoTunisiaTurkeyTurkmenistanUgandaUkraineUnited Arab EmiratesUnited KingdomUnited StatesUpper middle incomeUruguayUzbekistanVanuatuVenezuela, RBVietnamVirgin Islands (U.S.)West Bank and GazaWorldYemen, Rep.ZambiaZimbabwe Timeline:
This timeline shows a graph from 1961 to 2016 of Botswana. No data until 1960. Number of actual observations by date: 56.
Source name:
World Development Indicators
Source organization:
World Bank staff estimates based on male/female distributions of United Nations Population Division's World Population Prospects.
Categories, topics:
Health
Last updated:
apr 23, 2017
Indicators value changes by year
Minimum:
50.037
jan 1, 2016
Maximum:
52.316
jan 1, 1965
At the date of observation
Value
Absolute change
Change from previous value
jan 1, 1961
52.148
+52.148
0.0%
jan 1, 1962
52.227
+0.079
0.15%
jan 1, 1963
52.28
+0.053
0.1%
jan 1, 1964
52.309
+0.029
0.06%
jan 1, 1965
52.316
+0.007
0.01%
jan 1, 1966
52.305
-0.011
-0.02%
jan 1, 1967
52.275
-0.03
-0.06%
jan 1, 1968
52.226
-0.049
-0.09%
jan 1, 1969
52.163
-0.063
-0.12%
jan 1, 1970
52.088
-0.074
-0.14%
jan 1, 1971
52.006
-0.082
-0.16%
jan 1, 1972
51.918
-0.088
-0.17%
jan 1, 1973
51.827
-0.092
-0.18%
jan 1, 1974
51.731
-0.096
-0.18%
jan 1, 1975
51.633
-0.098
-0.19%
jan 1, 1976
51.532
-0.1
-0.19%
jan 1, 1977
51.431
-0.101
-0.2%
jan 1, 1978
51.331
-0.1
-0.19%
jan 1, 1979
51.237
-0.095
-0.18%
jan 1, 1980
51.152
-0.085
-0.17%
jan 1, 1981
51.078
-0.074
-0.14%
jan 1, 1982
51.015
-0.063
-0.12%
jan 1, 1983
50.962
-0.053
-0.1%
jan 1, 1984
50.915
-0.047
-0.09%
jan 1, 1985
50.872
-0.043
-0.09%
jan 1, 1986
50.829
-0.042
-0.08%
jan 1, 1987
50.788
-0.042
-0.08%
jan 1, 1988
50.747
-0.041
-0.08%
jan 1, 1989
50.707
-0.04
-0.08%
jan 1, 1990
50.668
-0.04
-0.08%
jan 1, 1991
50.628
-0.039
-0.08%
jan 1, 1992
50.589
-0.039
-0.08%
jan 1, 1993
50.549
-0.039
-0.08%
jan 1, 1994
50.51
-0.039
-0.08%
jan 1, 1995
50.471
-0.039
-0.08%
jan 1, 1996
50.432
-0.039
-0.08%
jan 1, 1997
50.392
-0.039
-0.08%
jan 1, 1998
50.353
-0.039
-0.08%
jan 1, 1999
50.315
-0.038
-0.08%
jan 1, 2000
50.278
-0.037
-0.07%
jan 1, 2001
50.242
-0.036
-0.07%
jan 1, 2002
50.207
-0.035
-0.07%
jan 1, 2003
50.174
-0.033
-0.07%
jan 1, 2004
50.143
-0.031
-0.06%
jan 1, 2005
50.117
-0.027
-0.05%
jan 1, 2006
50.095
-0.022
-0.04%
jan 1, 2007
50.079
-0.016
-0.03%
jan 1, 2008
50.067
-0.011
-0.02%
jan 1, 2009
50.06
-0.008
-0.02%
jan 1, 2010
50.054
-0.006
-0.01%
jan 1, 2011
50.049
-0.005
-0.01%
jan 1, 2012
50.045
-0.004
-0.01%
jan 1, 2013
50.041
-0.004
-0.01%
jan 1, 2014
50.038
-0.003
-0.01%
jan 1, 2015
50.037
-0.001
0.0%
jan 1, 2016
50.037
0.0
0.0%
Ranking of countries by current statistics by years


Comments: