29
/
en
AIzaSyAYiBZKx7MnpbEhh9jyipgxe19OcubqV5w
April 1, 2024
90179
Botswana
BWA
true
2
1
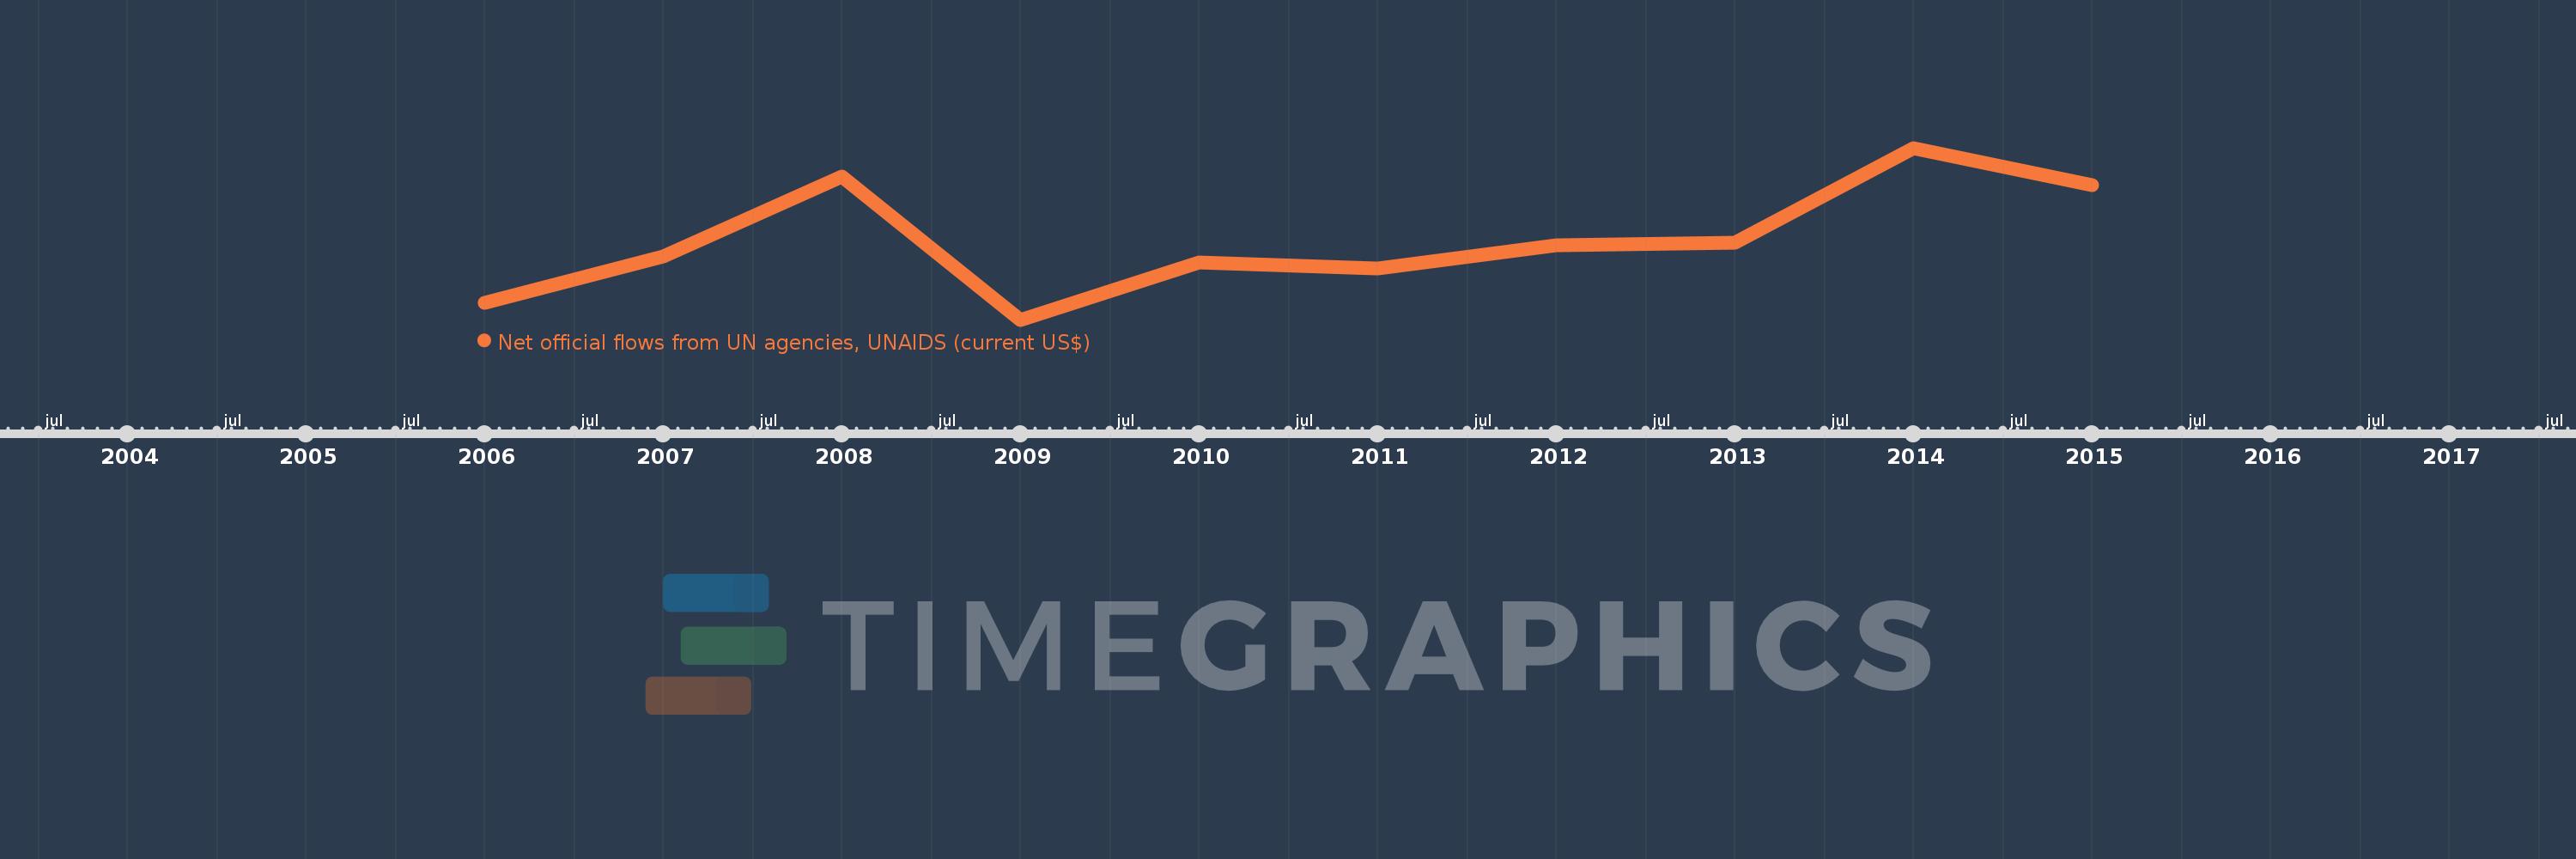
Net official flows from UN agencies, UNAIDS (current US$)
2015,2014,2013,2012,2011,2010,2009,2008,2007,2006
This statistics in other country:
Timeline:
This timeline shows a graph from 2006 to 2015 of Botswana. No data until 2005. Number of actual observations by date: 10.
Source name:
World Development Indicators
Source organization:
Development Assistance Committee of the Organisation for Economic Co-operation and Development, Geographical Distribution of Financial Flows to Developing Countries, Development Co-operation Report, and International Development Statistics database. Data are available online at: www.oecd.org/dac/stats/idsonline.
Categories, topics:
Aid Effectiveness
Last updated:
apr 23, 2017
Indicators value changes by year
Minimum:
470.0K
jan 1, 2009
Maximum:
1.07 mln
jan 1, 2014
At the date of observation
Value
Absolute change
Change from previous value
jan 1, 2006
530.0K
+530.0K
0.0%
jan 1, 2007
690.0K
+160.0K
30.19%
jan 1, 2008
970.0K
+280.0K
40.58%
jan 1, 2009
470.0K
-500.0K
-51.55%
jan 1, 2010
670.0K
+200.0K
42.55%
jan 1, 2011
650.0K
-20.0K
-2.99%
jan 1, 2012
730.0K
+80.0K
12.31%
jan 1, 2013
740.0K
+10.0K
1.37%
jan 1, 2014
1.07 mln
+330.0K
44.59%
jan 1, 2015
940.0K
-130.0K
-12.15%
Ranking of countries by current statistics by years


Comments: