29
/
en
AIzaSyAYiBZKx7MnpbEhh9jyipgxe19OcubqV5w
April 1, 2024
89586
Botswana
BWA
true
2
1
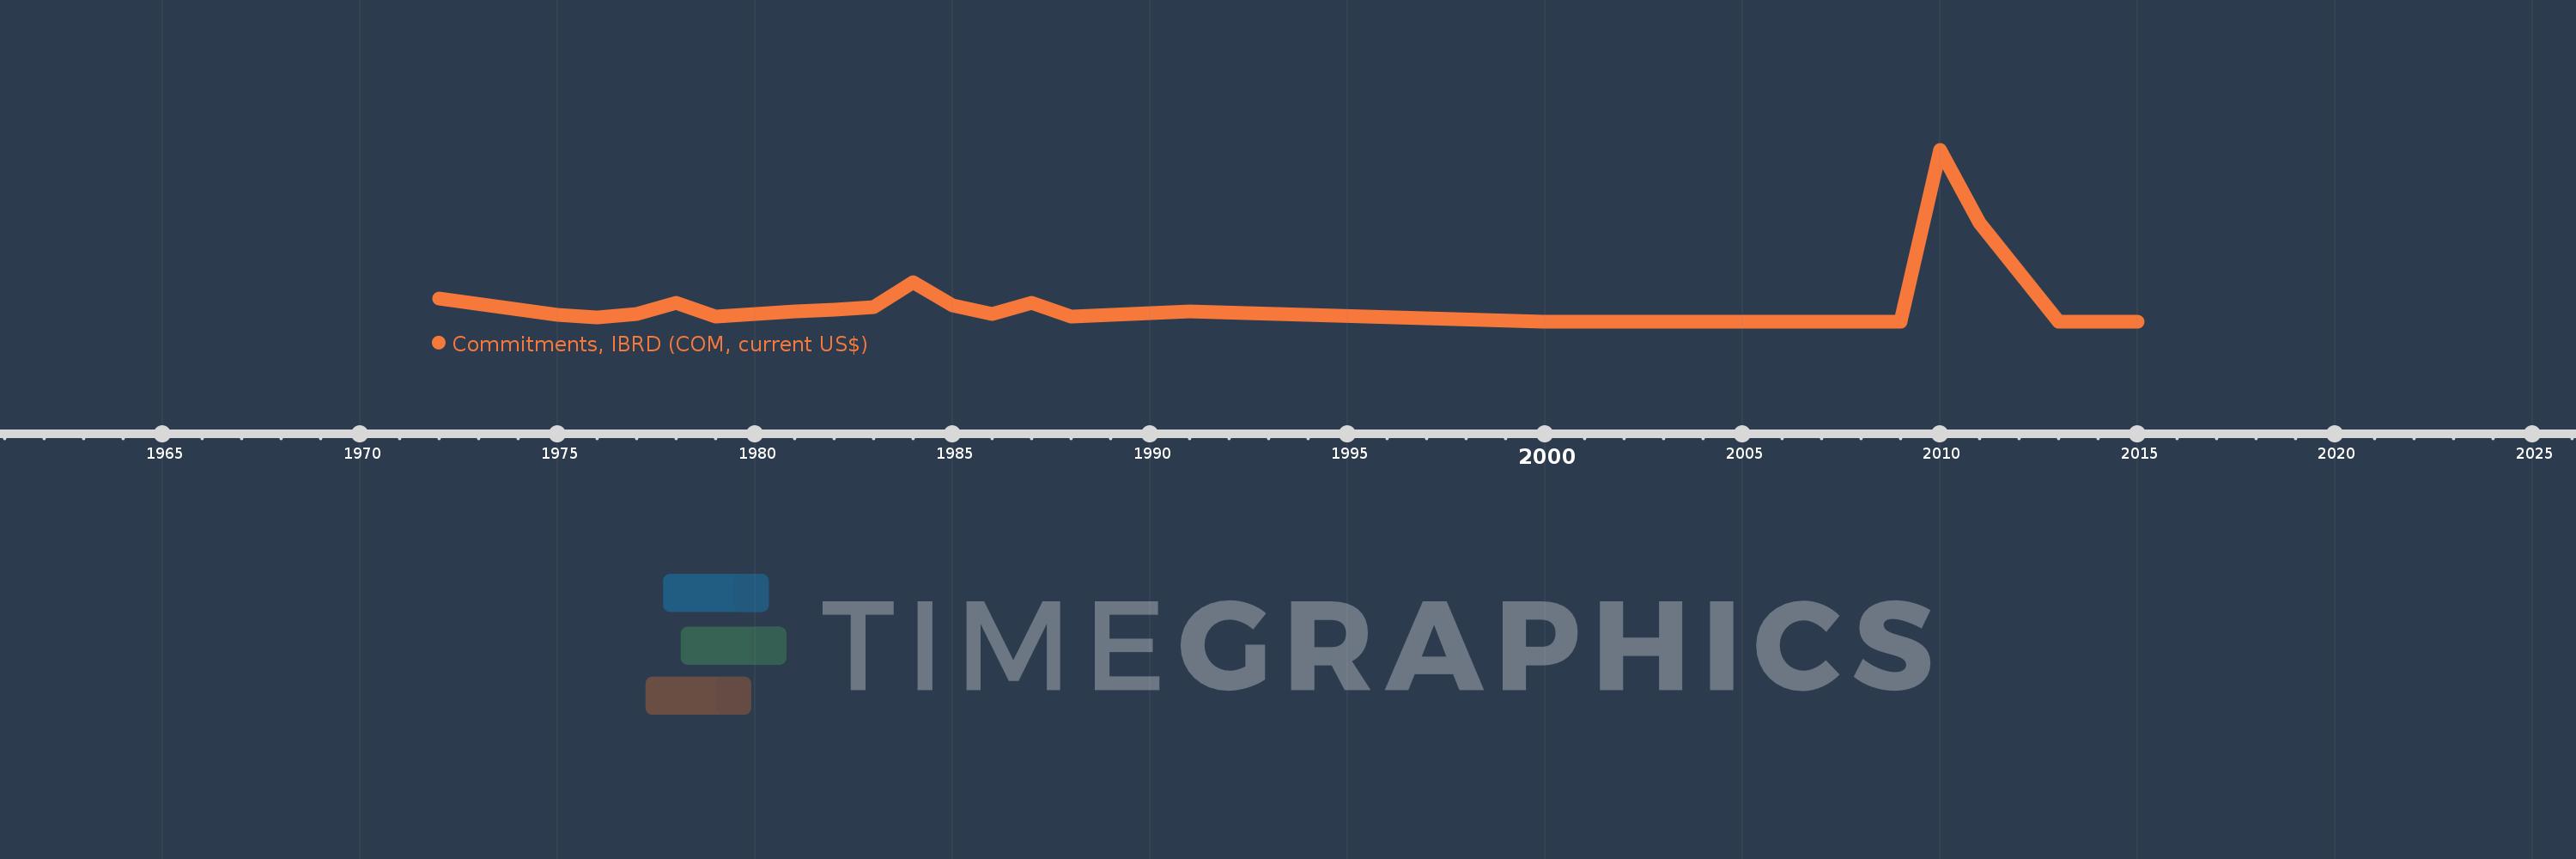
Commitments, IBRD (COM, current US$)
2015,2014,2013,2011,2010,2009,2008,2002,2000,1991,1988,1987,1986,1985,1984,1983,1982,1981,1979,1978,1977,1976,1975,1972
This statistics in other country:
Timeline:
This timeline shows a graph from 1972 to 2015 of Botswana. No data until 1971. Number of actual observations by date: 24.
Source name:
World Development Indicators
Source organization:
World Bank, International Debt Statistics.
Categories, topics:
External Debt
Last updated:
apr 23, 2017
Indicators value changes by year
Maximum:
236.0 mln
jan 1, 2010
At the date of observation
Value
Absolute change
Change from previous value
jan 1, 1972
32.0 mln
+32.0 mln
0.0%
jan 1, 1975
9.5 mln
-22.5 mln
-70.31%
jan 1, 1976
5.8 mln
-3.7 mln
-38.95%
jan 1, 1977
10.5 mln
+4.7 mln
81.03%
jan 1, 1978
26.5 mln
+16.0 mln
152.38%
jan 1, 1979
8.0 mln
-18.5 mln
-69.81%
jan 1, 1981
14.4 mln
+6.4 mln
80.0%
jan 1, 1982
17.0 mln
+2.6 mln
18.06%
jan 1, 1983
20.0 mln
+3.0 mln
17.65%
jan 1, 1984
54.5 mln
+34.5 mln
172.5%
jan 1, 1985
23.3 mln
-31.2 mln
-57.25%
jan 1, 1986
10.7 mln
-12.6 mln
-54.08%
jan 1, 1987
26.0 mln
+15.3 mln
142.99%
jan 1, 1988
7.6 mln
-18.4 mln
-70.77%
jan 1, 1991
14.9 mln
+7.3 mln
96.05%
jan 1, 2000
0.0
-14.9 mln
-100.0%
jan 1, 2010
236.0 mln
+236.0 mln
%
jan 1, 2011
136.4 mln
-99.6 mln
-42.2%
jan 1, 2013
0.0
-136.4 mln
-100.0%
Ranking of countries by current statistics by years


Comments: