29
/
en
AIzaSyAYiBZKx7MnpbEhh9jyipgxe19OcubqV5w
April 1, 2024
89457
Botswana
BWA
true
2
1
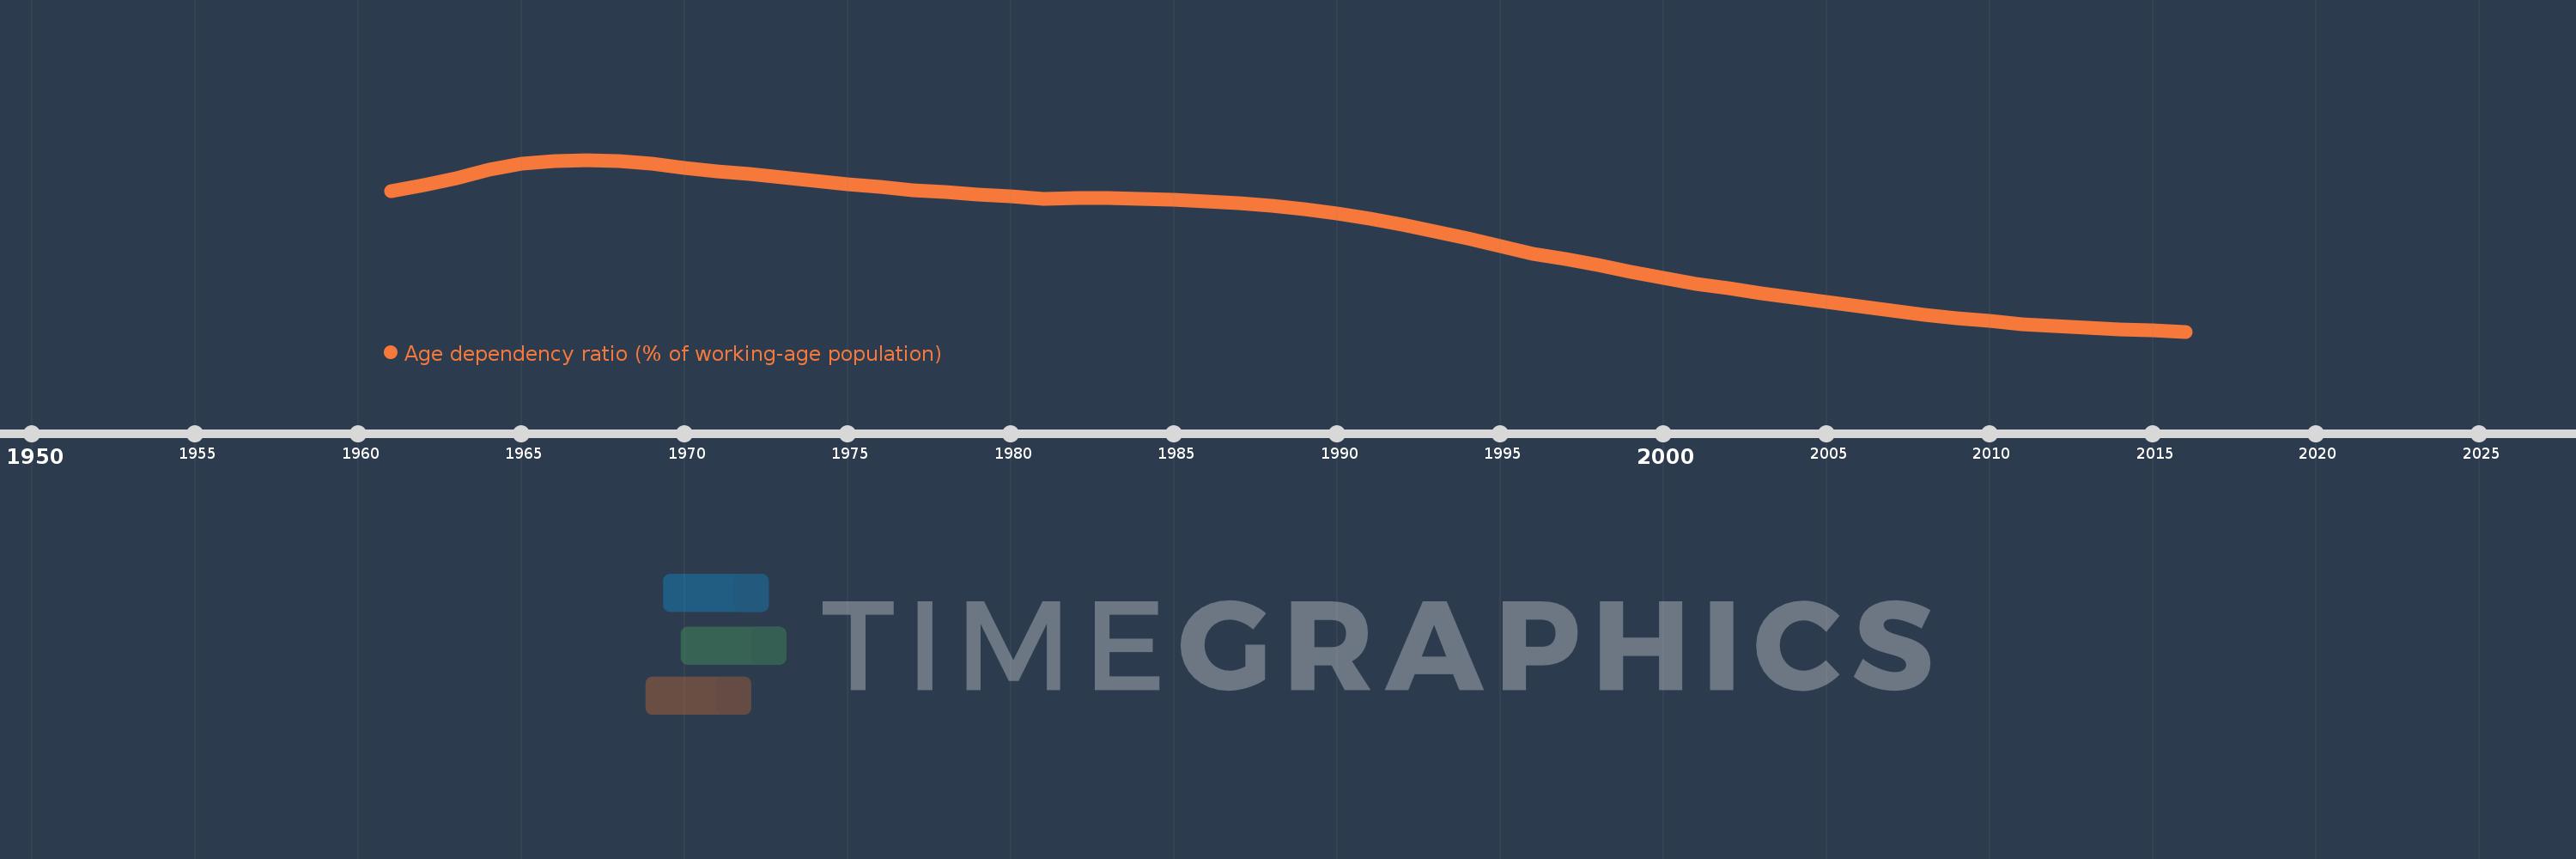
Age dependency ratio (% of working-age population)
2016,2015,2014,2013,2012,2011,2010,2009,2008,2007,2006,2005,2004,2003,2002,2001,2000,1999,1998,1997,1996,1995,1994,1993,1992,1991,1990,1989,1988,1987,1986,1985,1984,1983,1982,1981,1980,1979,1978,1977,1976,1975,1974,1973,1972,1971,1970,1969,1968,1967,1966,1965,1964,1963,1962,1961
This statistics in other country:
AfghanistanAlbaniaAlgeriaAngolaAntigua and BarbudaArab WorldArgentinaArmeniaArubaAustraliaAustriaAzerbaijanBahamas, TheBahrainBangladeshBarbadosBelarusBelgiumBelizeBeninBhutanBoliviaBosnia and HerzegovinaBotswanaBrazilBrunei DarussalamBulgariaBurkina FasoBurundiCabo VerdeCambodiaCameroonCanadaCaribbean small statesCentral African RepublicCentral Europe and the BalticsChadChannel IslandsChileChinaColombiaComorosCongo, Dem. Rep.Congo, Rep.Costa RicaCote d'IvoireCroatiaCubaCuracaoCyprusCzech RepublicDenmarkDjiboutiDominican RepublicEarly-demographic dividendEast Asia & PacificEast Asia & Pacific (excluding high income)East Asia & Pacific (IDA & IBRD countries)EcuadorEgypt, Arab Rep.El SalvadorEquatorial GuineaEritreaEstoniaEthiopiaEuro areaEurope & Central AsiaEurope & Central Asia (excluding high income)Europe & Central Asia (IDA & IBRD countries)European UnionFijiFinlandFragile and conflict affected situationsFranceFrench PolynesiaGabonGambia, TheGeorgiaGermanyGhanaGreeceGrenadaGuamGuatemalaGuineaGuinea-BissauGuyanaHaitiHeavily indebted poor countries (HIPC)High incomeHondurasHong Kong SAR, ChinaHungaryIBRD onlyIcelandIDA & IBRD totalIDA blendIDA onlyIDA totalIndiaIndonesiaIran, Islamic Rep.IraqIrelandIsraelItalyJamaicaJapanJordanKazakhstanKenyaKiribatiKorea, Dem. People’s Rep.Korea, Rep.KosovoKuwaitKyrgyz RepublicLao PDRLate-demographic dividendLatin America & Caribbean Latin America & Caribbean (excluding high income)Latin America & the Caribbean (IDA & IBRD countries)LatviaLeast developed countries: UN classificationLebanonLesothoLiberiaLibyaLithuaniaLow & middle incomeLow incomeLower middle incomeLuxembourgMacao SAR, ChinaMacedonia, FYRMadagascarMalawiMalaysiaMaldivesMaliMaltaMauritaniaMauritiusMexicoMicronesia, Fed. Sts.Middle East & North AfricaMiddle East & North Africa (excluding high income)Middle East & North Africa (IDA & IBRD countries)Middle incomeMoldovaMongoliaMontenegroMoroccoMozambiqueMyanmarNamibiaNepalNetherlandsNew CaledoniaNew ZealandNicaraguaNigerNigeriaNorth AmericaNorwayOECD membersOmanOther small statesPacific island small statesPakistanPanamaPapua New GuineaParaguayPeruPhilippinesPolandPortugalPost-demographic dividendPre-demographic dividendPuerto RicoQatarRomaniaRussian FederationRwandaSamoaSao Tome and PrincipeSaudi ArabiaSenegalSerbiaSeychellesSierra LeoneSingaporeSlovak RepublicSloveniaSmall statesSolomon IslandsSomaliaSouth AfricaSouth AsiaSouth Asia (IDA & IBRD)South SudanSpainSri LankaSt. LuciaSt. Vincent and the GrenadinesSub-Saharan Africa Sub-Saharan Africa (excluding high income)Sub-Saharan Africa (IDA & IBRD countries)SudanSurinameSwazilandSwedenSwitzerlandSyrian Arab RepublicTajikistanTanzaniaThailandTimor-LesteTogoTongaTrinidad and TobagoTunisiaTurkeyTurkmenistanUgandaUkraineUnited Arab EmiratesUnited KingdomUnited StatesUpper middle incomeUruguayUzbekistanVanuatuVenezuela, RBVietnamVirgin Islands (U.S.)West Bank and GazaWorldYemen, Rep.ZambiaZimbabwe Timeline:
This timeline shows a graph from 1961 to 2016 of Botswana. No data until 1960. Number of actual observations by date: 56.
Source name:
World Development Indicators
Source organization:
World Bank staff estimates using the World Bank's population and age distributions of the United Nations Population Division's World Population Prospects. The World Bank's population estimates are from various sources including the United Nations Population Division's World Population Prospects; census reports and statistical publications from national statistical offices; Eurostat's Demographic Statistics; United Nations Statistical Division, Population and Vital Statistics Report (various years); U.S. Census Bureau: International Database; and Secretariat of the Pacific Community, Statistics and Demography Programme.
Categories, topics:
Health
Last updated:
apr 23, 2017
Indicators value changes by year
Maximum:
108.019
jan 1, 1967
At the date of observation
Value
Absolute change
Change from previous value
jan 1, 1961
98.319
+98.319
0.0%
jan 1, 1962
100.147
+1.828
1.86%
jan 1, 1963
102.469
+2.322
2.32%
jan 1, 1964
104.874
+2.404
2.35%
jan 1, 1965
106.704
+1.83
1.75%
jan 1, 1966
107.655
+0.951
0.89%
jan 1, 1967
108.019
+0.365
0.34%
jan 1, 1968
107.633
-0.387
-0.36%
jan 1, 1969
106.709
-0.924
-0.86%
jan 1, 1970
105.604
-1.105
-1.04%
jan 1, 1971
104.523
-1.081
-1.02%
jan 1, 1972
103.561
-0.962
-0.92%
jan 1, 1973
102.498
-1.063
-1.03%
jan 1, 1974
101.436
-1.062
-1.04%
jan 1, 1975
100.448
-0.987
-0.97%
jan 1, 1976
99.587
-0.862
-0.86%
jan 1, 1977
98.741
-0.845
-0.85%
jan 1, 1978
97.997
-0.745
-0.75%
jan 1, 1979
97.334
-0.662
-0.68%
jan 1, 1980
96.697
-0.637
-0.65%
jan 1, 1981
96.044
-0.653
-0.68%
jan 1, 1982
96.222
+0.178
0.19%
jan 1, 1983
96.203
-0.019
-0.02%
jan 1, 1984
96.023
-0.18
-0.19%
jan 1, 1985
95.703
-0.32
-0.33%
jan 1, 1986
95.226
-0.477
-0.5%
jan 1, 1987
94.739
-0.487
-0.51%
jan 1, 1988
93.98
-0.759
-0.8%
jan 1, 1989
92.948
-1.032
-1.1%
jan 1, 1990
91.62
-1.328
-1.43%
jan 1, 1991
89.997
-1.623
-1.77%
jan 1, 1992
88.164
-1.833
-2.04%
jan 1, 1993
86.125
-2.039
-2.31%
jan 1, 1994
83.922
-2.203
-2.56%
jan 1, 1995
81.601
-2.321
-2.77%
jan 1, 1996
79.212
-2.389
-2.93%
jan 1, 1997
77.446
-1.766
-2.23%
jan 1, 1998
75.586
-1.86
-2.4%
jan 1, 1999
73.667
-1.919
-2.54%
jan 1, 2000
71.724
-1.944
-2.64%
jan 1, 2001
69.785
-1.938
-2.7%
jan 1, 2002
68.459
-1.327
-1.9%
jan 1, 2003
67.06
-1.399
-2.04%
jan 1, 2004
65.658
-1.402
-2.09%
jan 1, 2005
64.333
-1.325
-2.02%
jan 1, 2006
63.129
-1.204
-1.87%
jan 1, 2007
61.705
-1.424
-2.26%
jan 1, 2008
60.469
-1.237
-2.0%
jan 1, 2009
59.393
-1.076
-1.78%
jan 1, 2010
58.439
-0.954
-1.61%
jan 1, 2011
57.597
-0.842
-1.44%
jan 1, 2012
56.943
-0.653
-1.13%
jan 1, 2013
56.404
-0.54
-0.95%
jan 1, 2014
55.967
-0.436
-0.77%
jan 1, 2015
55.601
-0.367
-0.66%
jan 1, 2016
55.27
-0.33
-0.59%
Ranking of countries by current statistics by years


Comments: