29
/
en
AIzaSyAYiBZKx7MnpbEhh9jyipgxe19OcubqV5w
April 1, 2024
86467
Bhutan
BTN
true
2
1
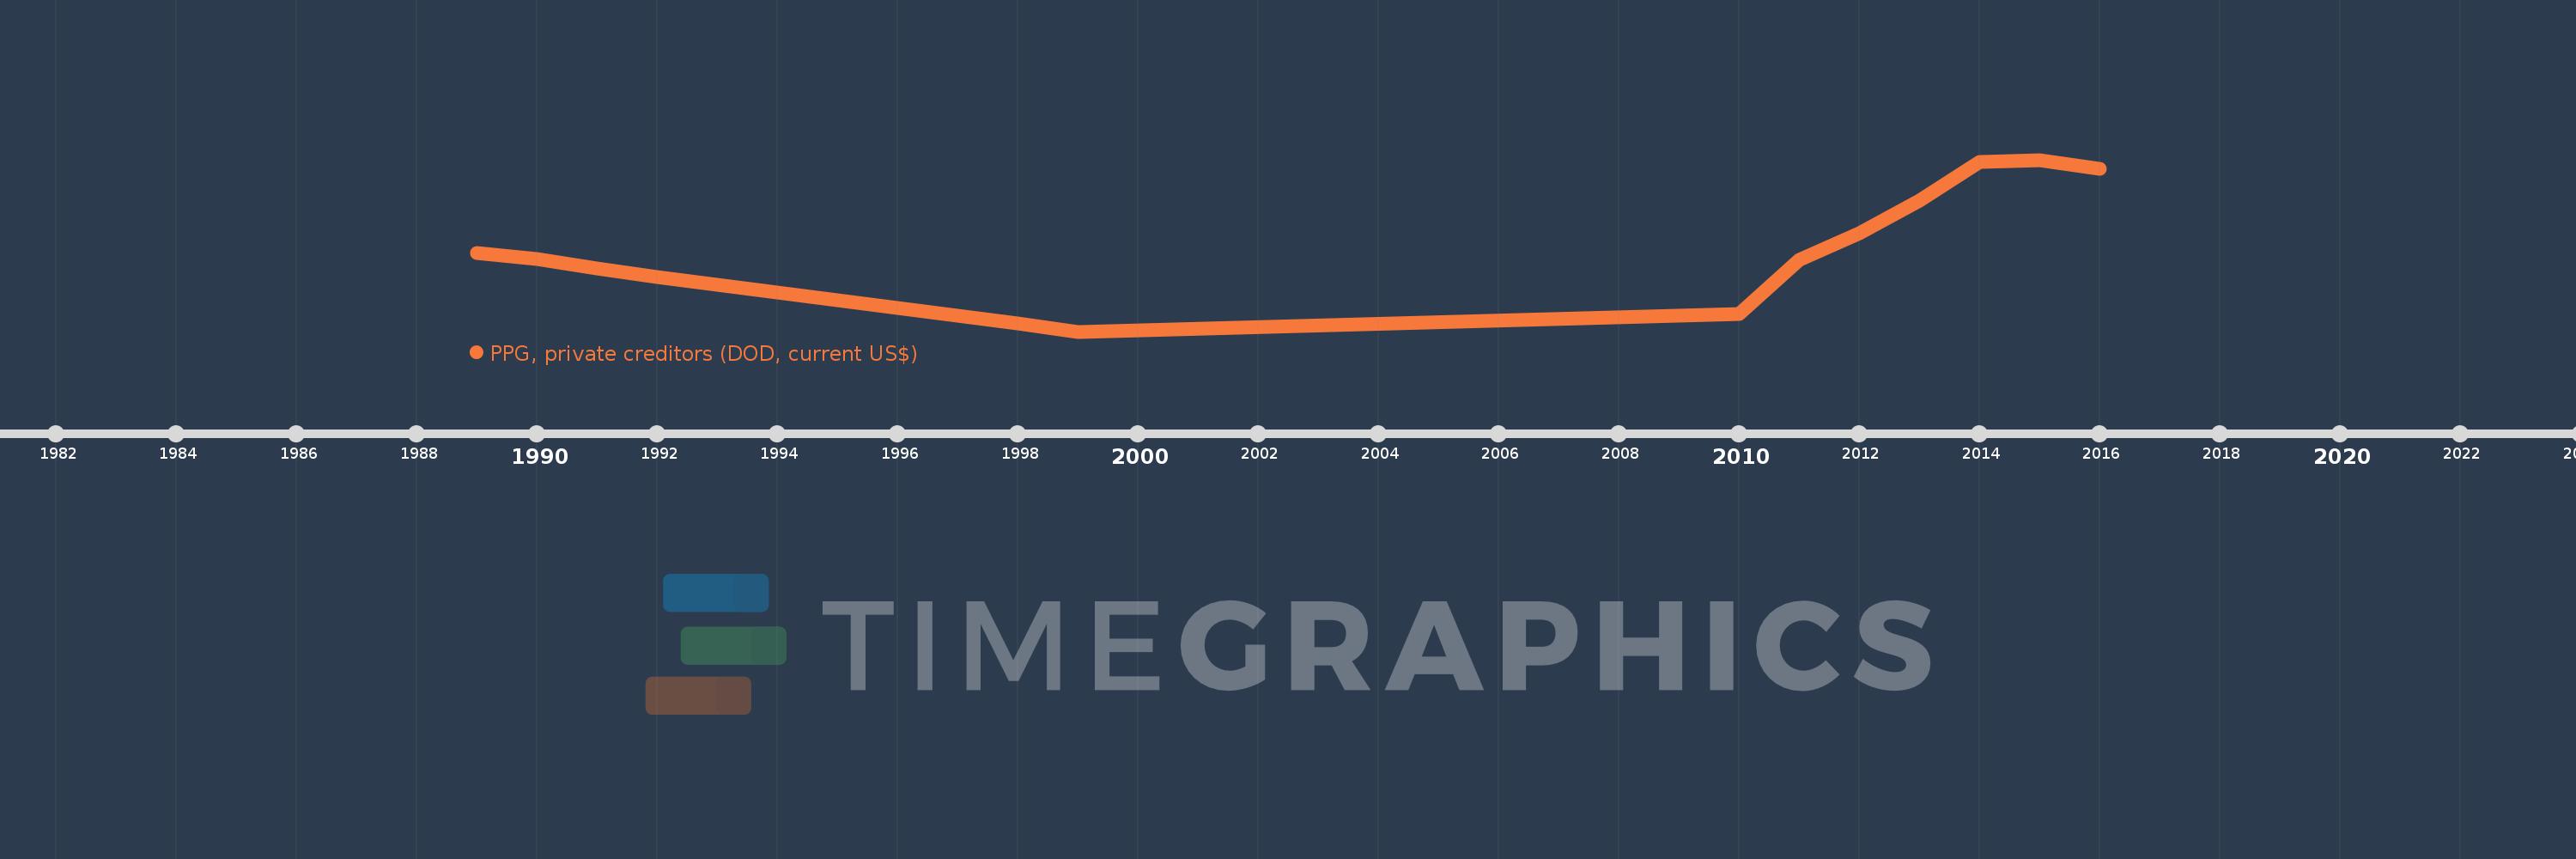
PPG, private creditors (DOD, current US$)
2016,2015,2014,2013,2012,2011,2010,1999,1998,1997,1996,1995,1994,1993,1992,1991,1990,1989
This statistics in other country:
Timeline:
This timeline shows a graph from 1989 to 2016 of Bhutan. No data until 1988. Number of actual observations by date: 18.
Source name:
World Development Indicators
Source organization:
World Bank, International Debt Statistics.
Categories, topics:
External Debt
Last updated:
apr 23, 2017
Indicators value changes by year
Maximum:
50.06 mln
jan 1, 2015
At the date of observation
Value
Absolute change
Change from previous value
jan 1, 1989
22.911 mln
+22.911 mln
0.0%
jan 1, 1990
21.095 mln
-1.816 mln
-7.93%
jan 1, 1991
18.461 mln
-2.634 mln
-12.49%
jan 1, 1992
15.95 mln
-2.511 mln
-13.6%
jan 1, 1993
13.565 mln
-2.385 mln
-14.95%
jan 1, 1994
11.304 mln
-2.261 mln
-16.67%
jan 1, 1995
9.043 mln
-2.261 mln
-20.0%
jan 1, 1996
6.782 mln
-2.261 mln
-25.0%
jan 1, 1997
4.521 mln
-2.261 mln
-33.34%
jan 1, 1998
2.26 mln
-2.261 mln
-50.01%
jan 1, 1999
0.0
-2.26 mln
-100.0%
jan 1, 2010
5.082 mln
+5.082 mln
%
jan 1, 2011
20.877 mln
+15.795 mln
310.8%
jan 1, 2012
28.729 mln
+7.852 mln
37.61%
jan 1, 2013
38.212 mln
+9.483 mln
33.01%
jan 1, 2014
49.46 mln
+11.248 mln
29.44%
jan 1, 2015
50.06 mln
+600.0K
1.21%
jan 1, 2016
47.473 mln
-2.587 mln
-5.17%
Ranking of countries by current statistics by years


Comments: