29
/
en
AIzaSyAYiBZKx7MnpbEhh9jyipgxe19OcubqV5w
April 1, 2024
86358
Bhutan
BTN
true
2
1
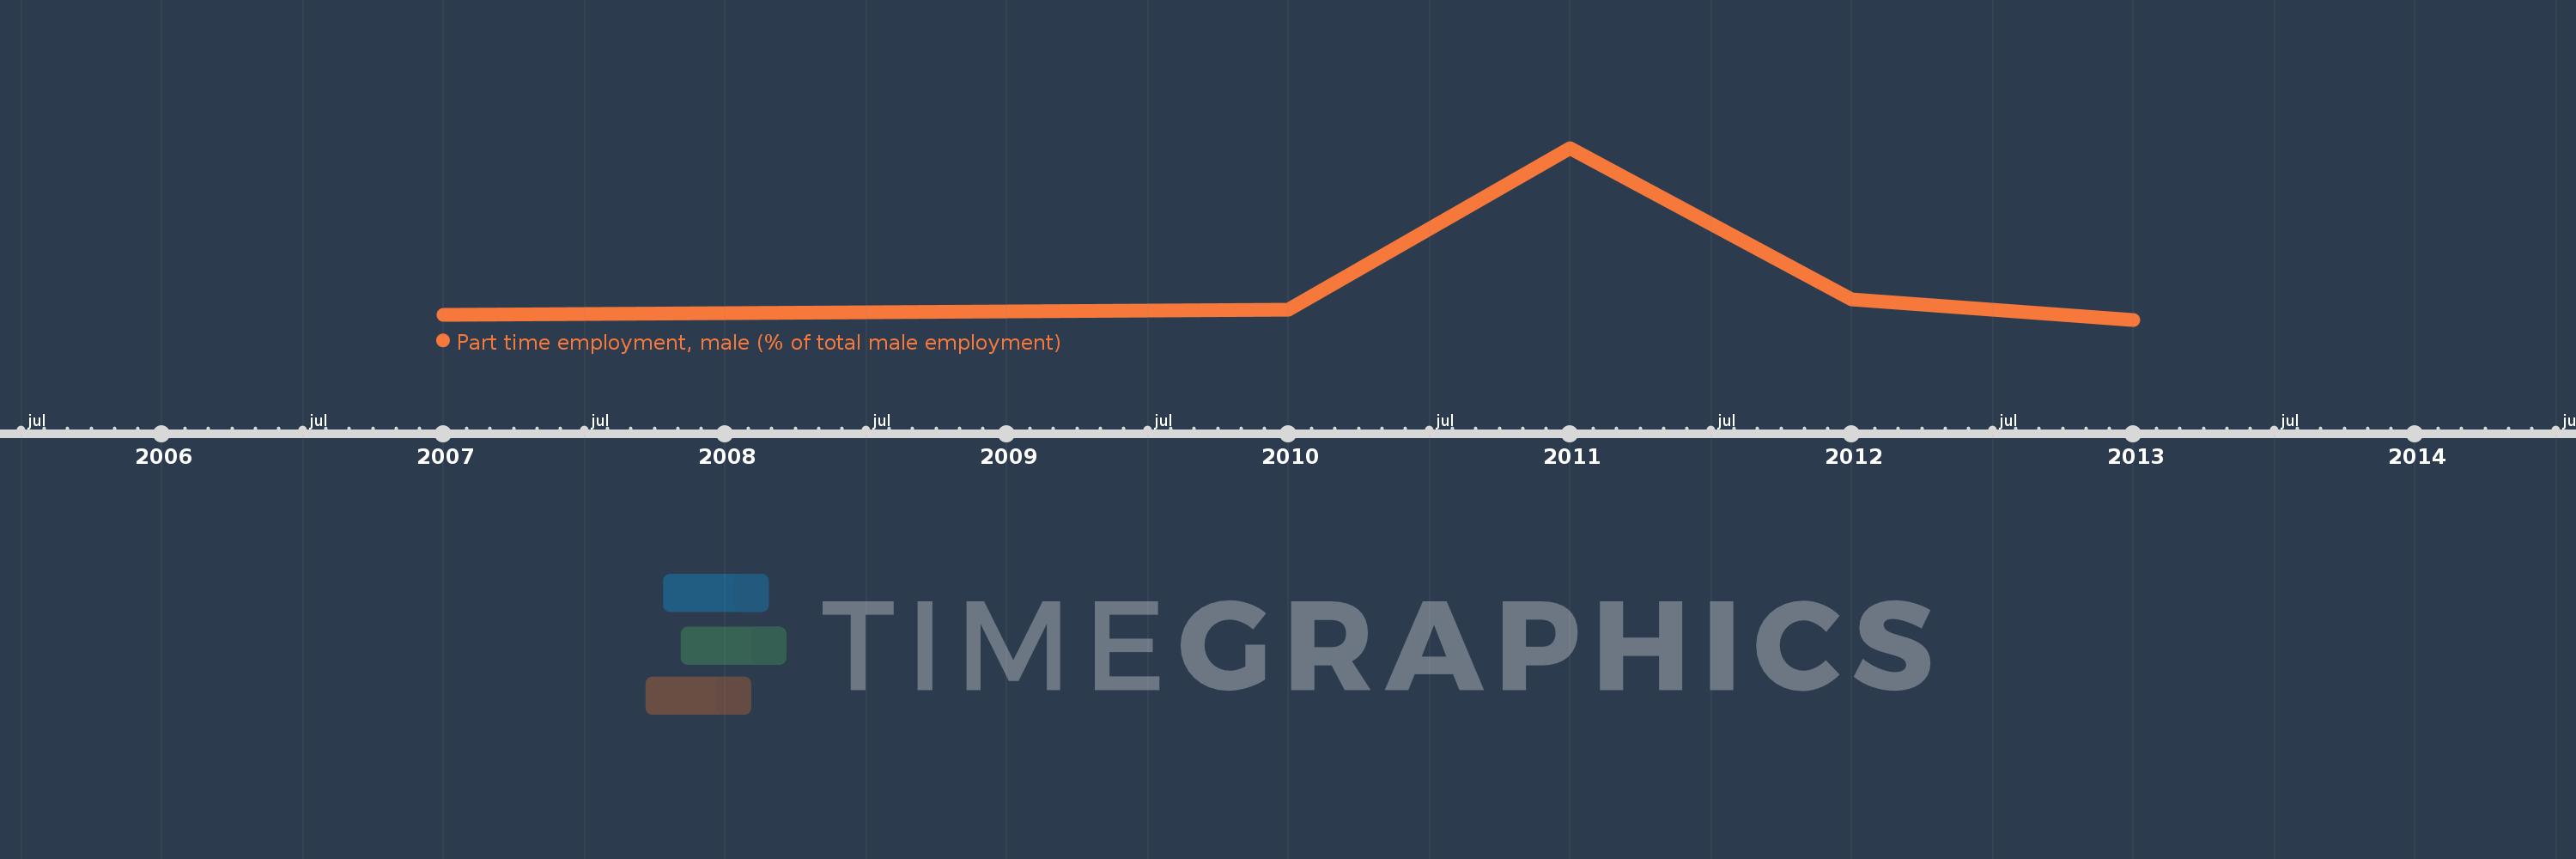
Part time employment, male (% of total male employment)
2013,2012,2011,2010,2007
This statistics in other country:
Timeline:
This timeline shows a graph from 2007 to 2013 of Bhutan. No data until 2006. Number of actual observations by date: 5.
Source name:
World Development Indicators
Source organization:
International Labour Organization, Key Indicators of the Labour Market database.
Categories, topics:
Social Protection & Labor, Gender
Last updated:
apr 23, 2017
Indicators value changes by year
At the date of observation
Value
Absolute change
Change from previous value
jan 1, 2010
4.2
+1.5
55.56%
jan 1, 2011
48.8
+44.6
1.06K%
jan 1, 2012
7.1
-41.7
-85.45%
jan 1, 2013
1.4
-5.7
-80.28%
Ranking of countries by current statistics by years


Comments: