29
/
en
AIzaSyAYiBZKx7MnpbEhh9jyipgxe19OcubqV5w
April 1, 2024
85639
Bhutan
BTN
true
2
1
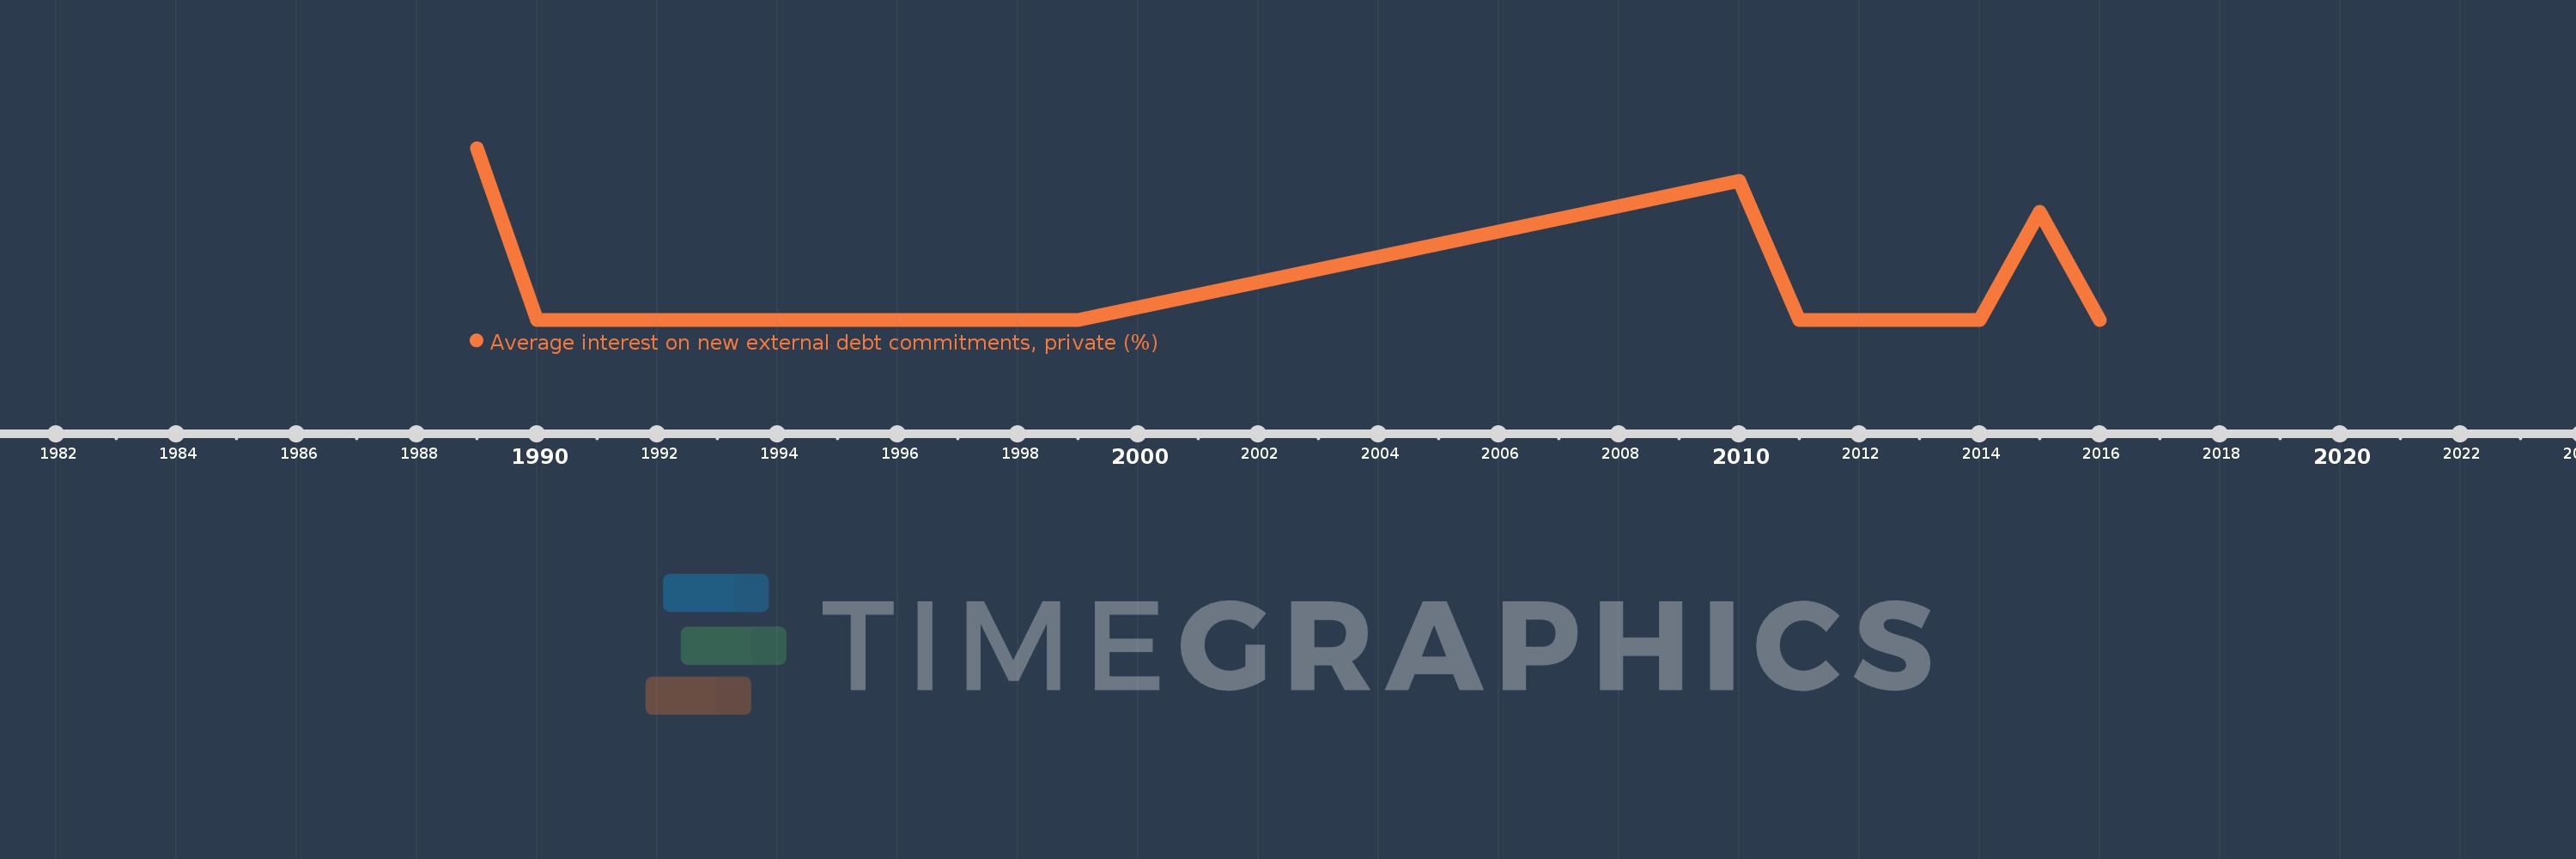
Average interest on new external debt commitments, private (%)
2016,2015,2014,2013,2012,2011,2010,1999,1998,1997,1996,1995,1994,1993,1992,1991,1990,1989
This statistics in other country:
Timeline:
This timeline shows a graph from 1989 to 2016 of Bhutan. No data until 1988. Number of actual observations by date: 18.
Source name:
World Development Indicators
Source organization:
World Bank, International Debt Statistics.
Categories, topics:
External Debt
Last updated:
apr 23, 2017
Indicators value changes by year
At the date of observation
Value
Absolute change
Change from previous value
jan 1, 1989
7.317
+7.317
0.0%
jan 1, 1990
0.0
-7.317
-100.0%
jan 1, 2011
0.0
-5.92
-100.0%
jan 1, 2015
4.583
+4.583
%
jan 1, 2016
0.0
-4.583
-100.0%
Ranking of countries by current statistics by years


Comments: