29
/
en
AIzaSyAYiBZKx7MnpbEhh9jyipgxe19OcubqV5w
April 1, 2024
85274
Bermuda
BMU
true
2
1
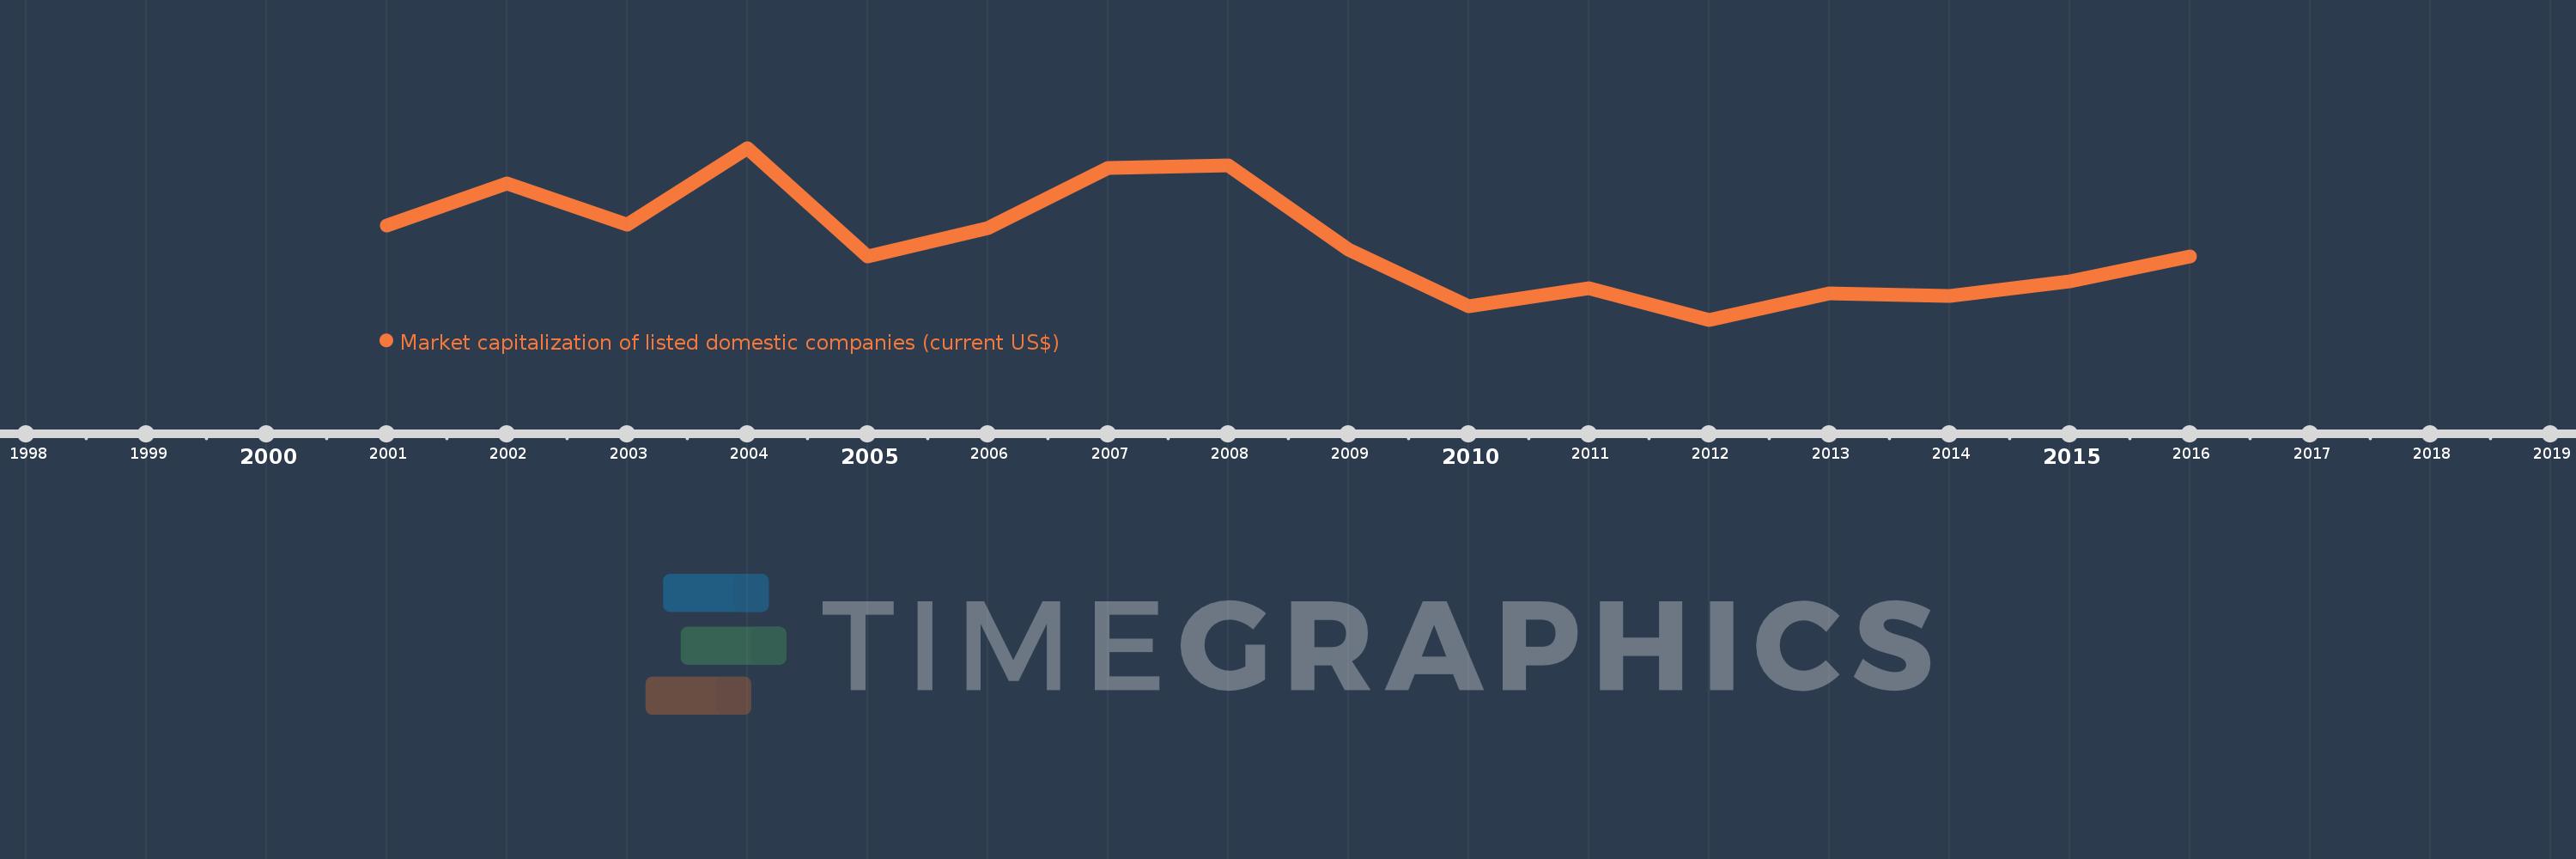
Market capitalization of listed domestic companies (current US$)
2016,2015,2014,2013,2012,2011,2010,2009,2008,2007,2006,2005,2004,2003,2002,2001
This statistics in other country:
Timeline:
This timeline shows a graph from 2001 to 2016 of Bermuda. No data until 2000. Number of actual observations by date: 16.
Source name:
World Development Indicators
Source organization:
World Federation of Exchanges database.
Categories, topics:
Financial Sector
Last updated:
apr 23, 2017
Indicators value changes by year
Minimum:
1.232 bln
jan 1, 2012
Maximum:
2.901 bln
jan 1, 2004
At the date of observation
Value
Absolute change
Change from previous value
jan 1, 2001
2.146 bln
+2.146 bln
0.0%
jan 1, 2002
2.558 bln
+412.0 mln
19.2%
jan 1, 2003
2.153 bln
-405.0 mln
-15.83%
jan 1, 2004
2.901 bln
+747.7 mln
34.73%
jan 1, 2005
1.849 bln
-1.051 bln
-36.24%
jan 1, 2006
2.125 bln
+275.34 mln
14.89%
jan 1, 2007
2.704 bln
+578.75 mln
27.24%
jan 1, 2008
2.731 bln
+27.58 mln
1.02%
jan 1, 2009
1.912 bln
-818.78 mln
-29.98%
jan 1, 2010
1.36 bln
-552.14 mln
-28.87%
jan 1, 2011
1.535 bln
+174.76 mln
12.85%
jan 1, 2012
1.232 bln
-302.61 mln
-19.71%
jan 1, 2013
1.487 bln
+254.56 mln
20.66%
jan 1, 2014
1.467 bln
-19.9 mln
-1.34%
jan 1, 2015
1.601 bln
+134.48 mln
9.17%
jan 1, 2016
1.85 bln
+248.52 mln
15.52%
Ranking of countries by current statistics by years


Comments: