29
/
en
AIzaSyAYiBZKx7MnpbEhh9jyipgxe19OcubqV5w
April 1, 2024
83583
Belize
BLZ
true
2
1
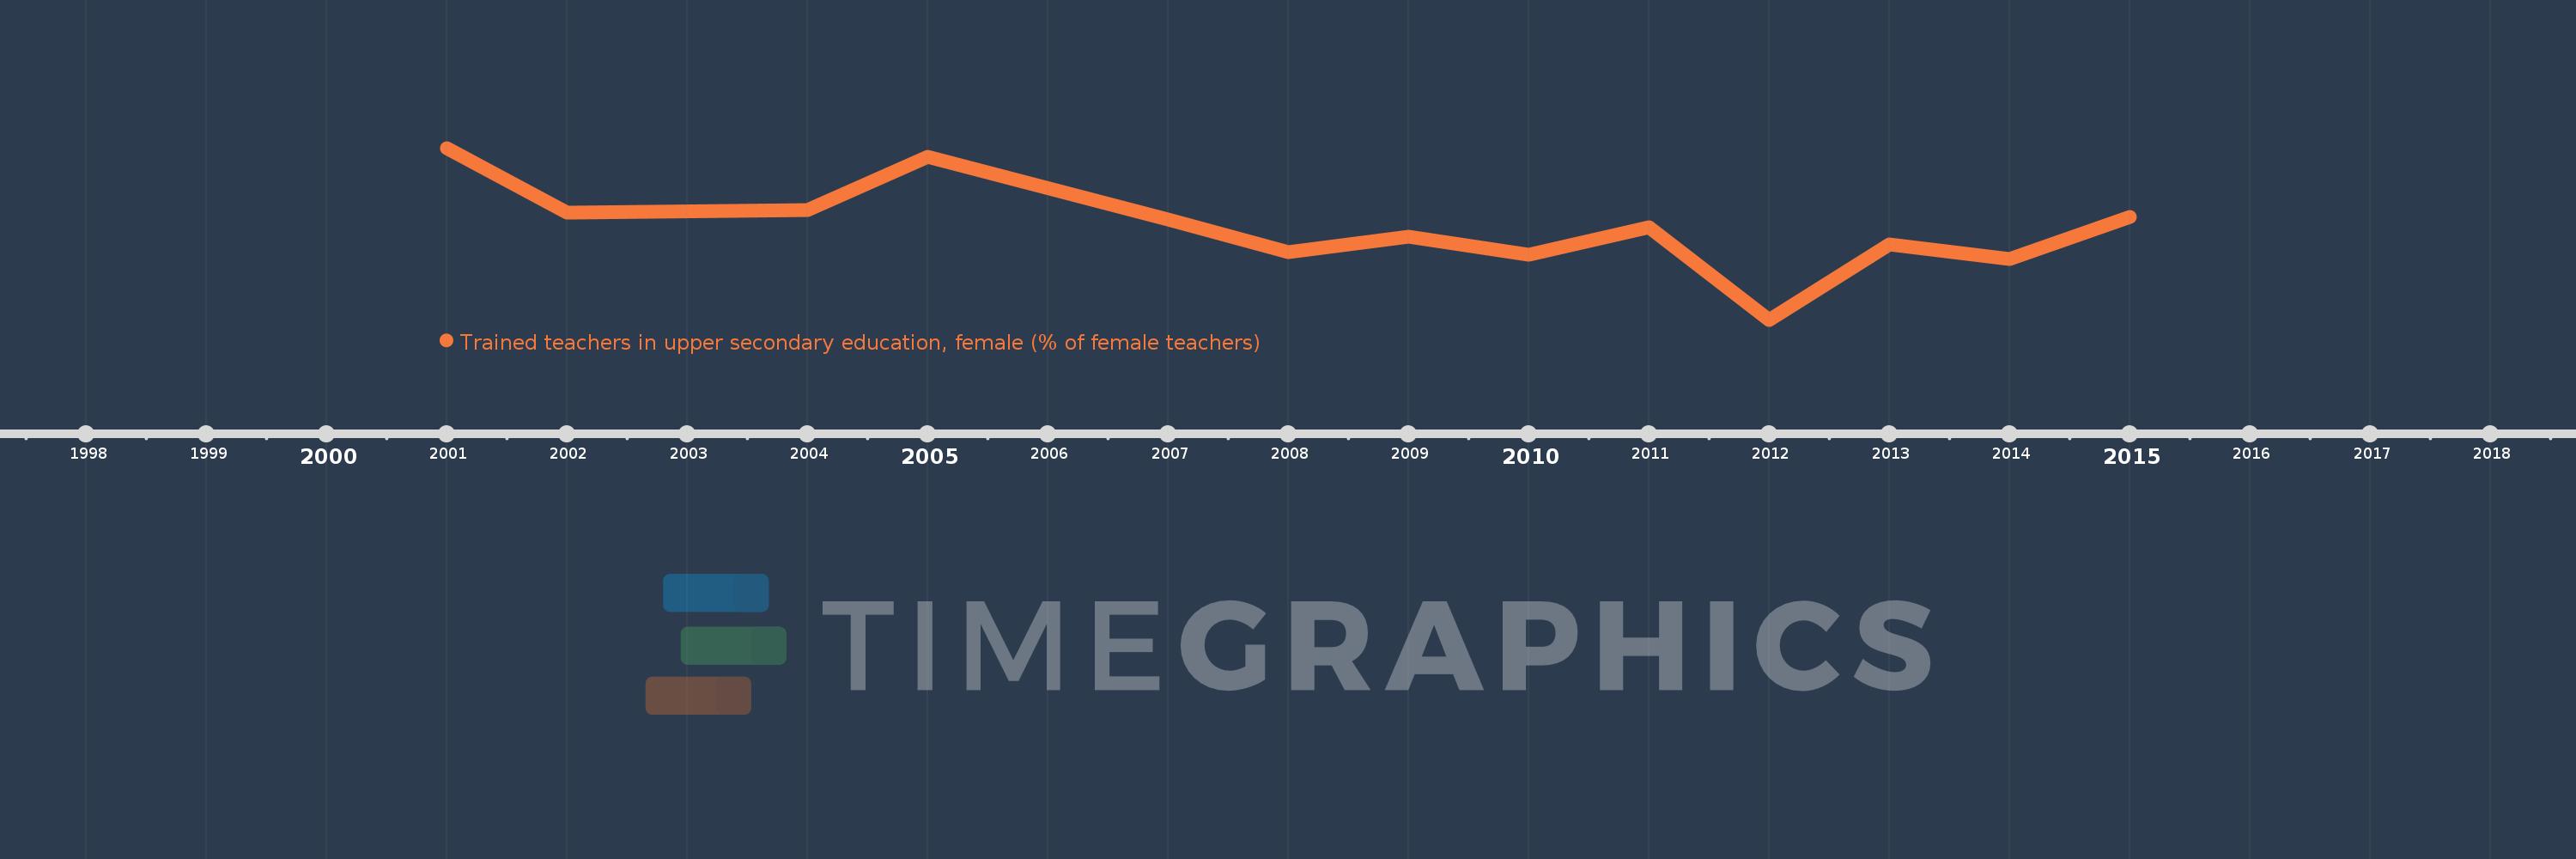
Trained teachers in upper secondary education, female (% of female teachers)
2015,2014,2013,2012,2011,2010,2009,2008,2007,2005,2004,2002,2001
This statistics in other country:
Timeline:
This timeline shows a graph from 2001 to 2015 of Belize. No data until 2000. Number of actual observations by date: 13.
Source name:
World Development Indicators
Source organization:
United Nations Educational, Scientific, and Cultural Organization (UNESCO) Institute for Statistics.
Categories, topics:
Education
Last updated:
apr 23, 2017
Indicators value changes by year
Maximum:
54.815
jan 1, 2001
At the date of observation
Value
Absolute change
Change from previous value
jan 1, 2001
54.815
+54.815
0.0%
jan 1, 2002
42.466
-12.349
-22.53%
jan 1, 2004
43.005
+0.539
1.27%
jan 1, 2005
53.2
+10.195
23.71%
jan 1, 2007
41.176
-12.024
-22.6%
jan 1, 2008
34.853
-6.323
-15.36%
jan 1, 2009
37.906
+3.053
8.76%
jan 1, 2010
34.42
-3.486
-9.2%
jan 1, 2011
39.649
+5.229
15.19%
jan 1, 2012
22.0
-17.649
-44.51%
jan 1, 2013
36.446
+14.446
65.66%
jan 1, 2014
33.634
-2.812
-7.72%
jan 1, 2015
41.617
+7.983
23.74%
Ranking of countries by current statistics by years


Comments: