29
/
en
AIzaSyAYiBZKx7MnpbEhh9jyipgxe19OcubqV5w
April 1, 2024
81622
Belgium
BEL
true
2
1
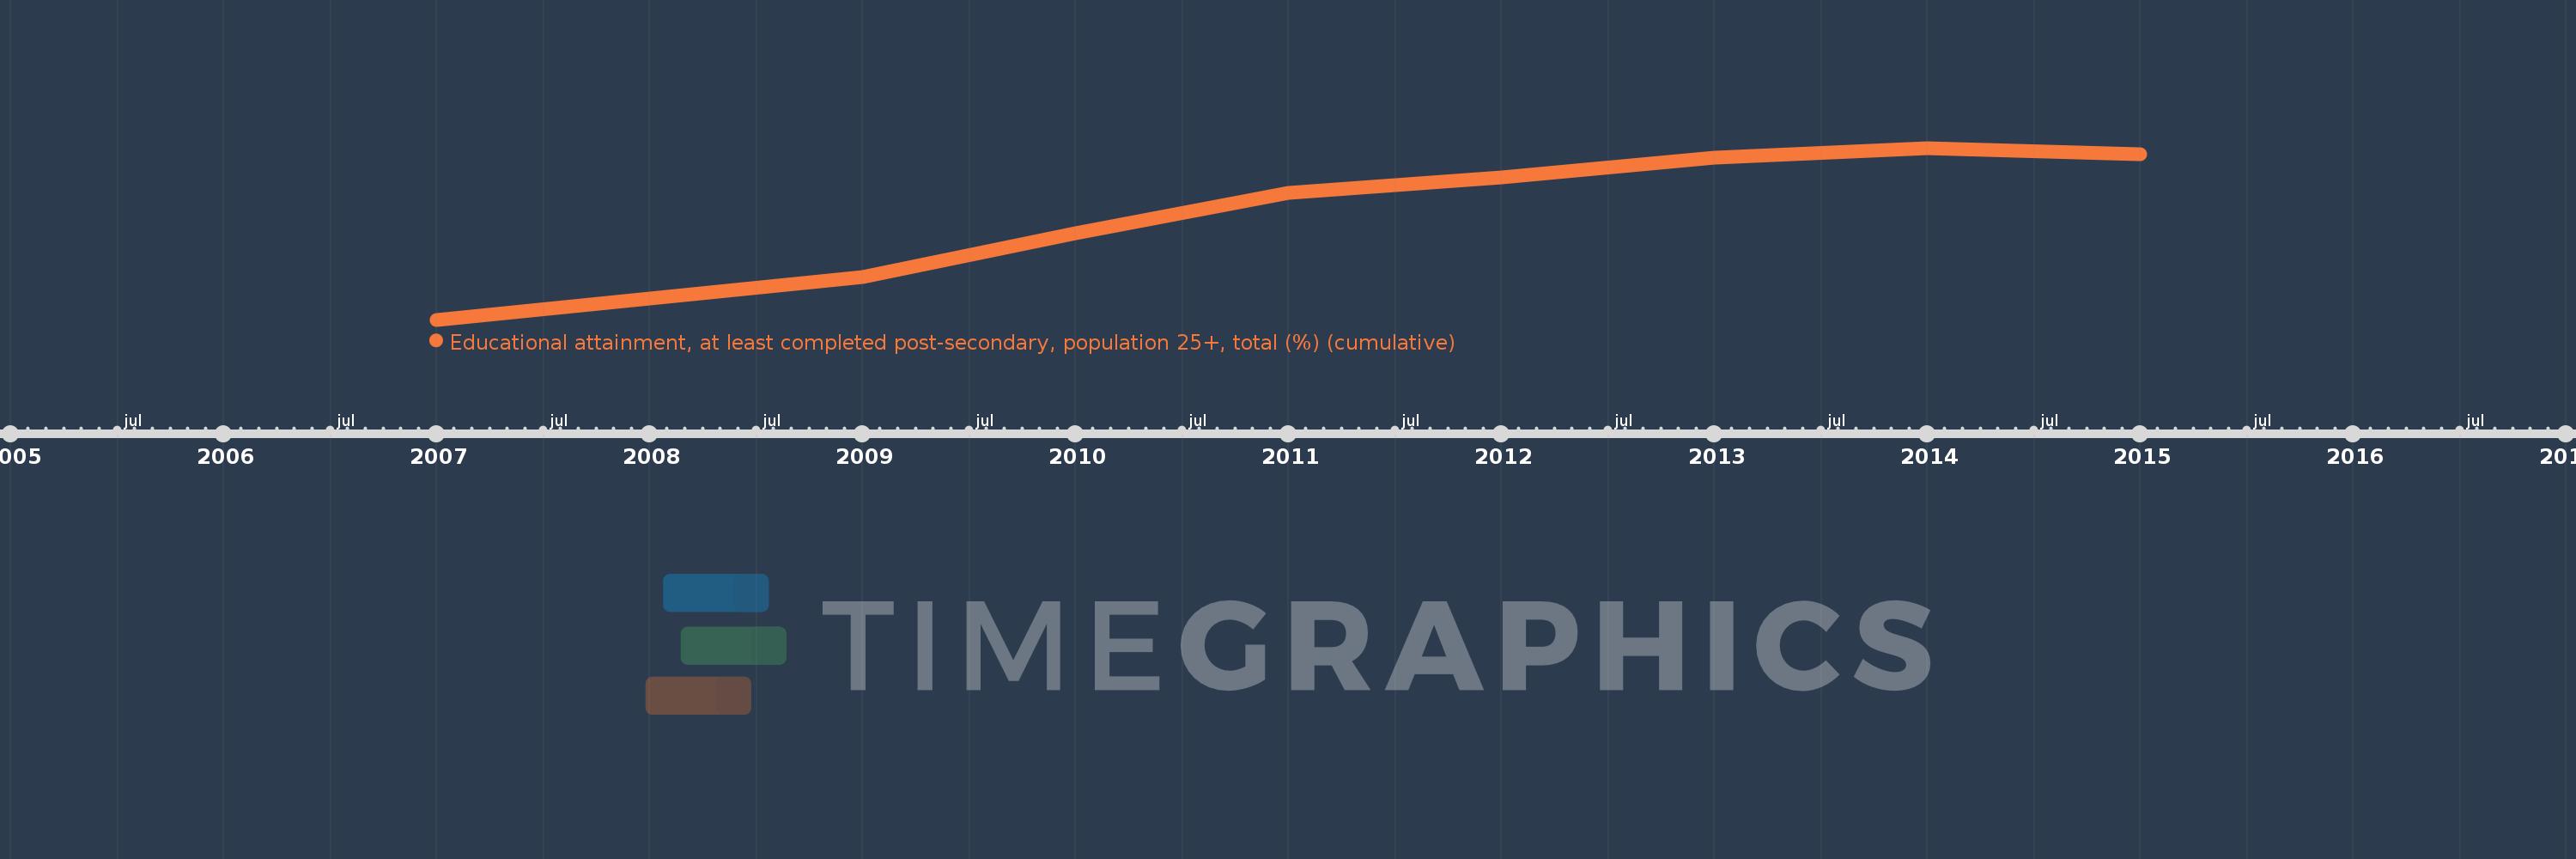
Educational attainment, at least completed post-secondary, population 25+, total (%) (cumulative)
2015,2014,2013,2012,2011,2010,2009,2007
This statistics in other country:
Timeline:
This timeline shows a graph from 2007 to 2015 of Belgium. No data until 2006. Number of actual observations by date: 8.
Source name:
World Development Indicators
Source organization:
United Nations Educational, Scientific, and Cultural Organization (UNESCO) Institute for Statistics.
Categories, topics:
Education, Gender
Last updated:
apr 23, 2017
Indicators value changes by year
Minimum:
28.206
jan 1, 2007
Maximum:
32.985
jan 1, 2014
At the date of observation
Value
Absolute change
Change from previous value
jan 1, 2007
28.206
+28.206
0.0%
jan 1, 2009
29.387
+1.182
4.19%
jan 1, 2010
30.618
+1.231
4.19%
jan 1, 2011
31.74
+1.123
3.67%
jan 1, 2012
32.156
+0.416
1.31%
jan 1, 2013
32.712
+0.556
1.73%
jan 1, 2014
32.985
+0.273
0.83%
jan 1, 2015
32.803
-0.182
-0.55%
Ranking of countries by current statistics by years


Comments: