29
/
en
AIzaSyAYiBZKx7MnpbEhh9jyipgxe19OcubqV5w
April 1, 2024
81621
Belgium
BEL
true
2
1
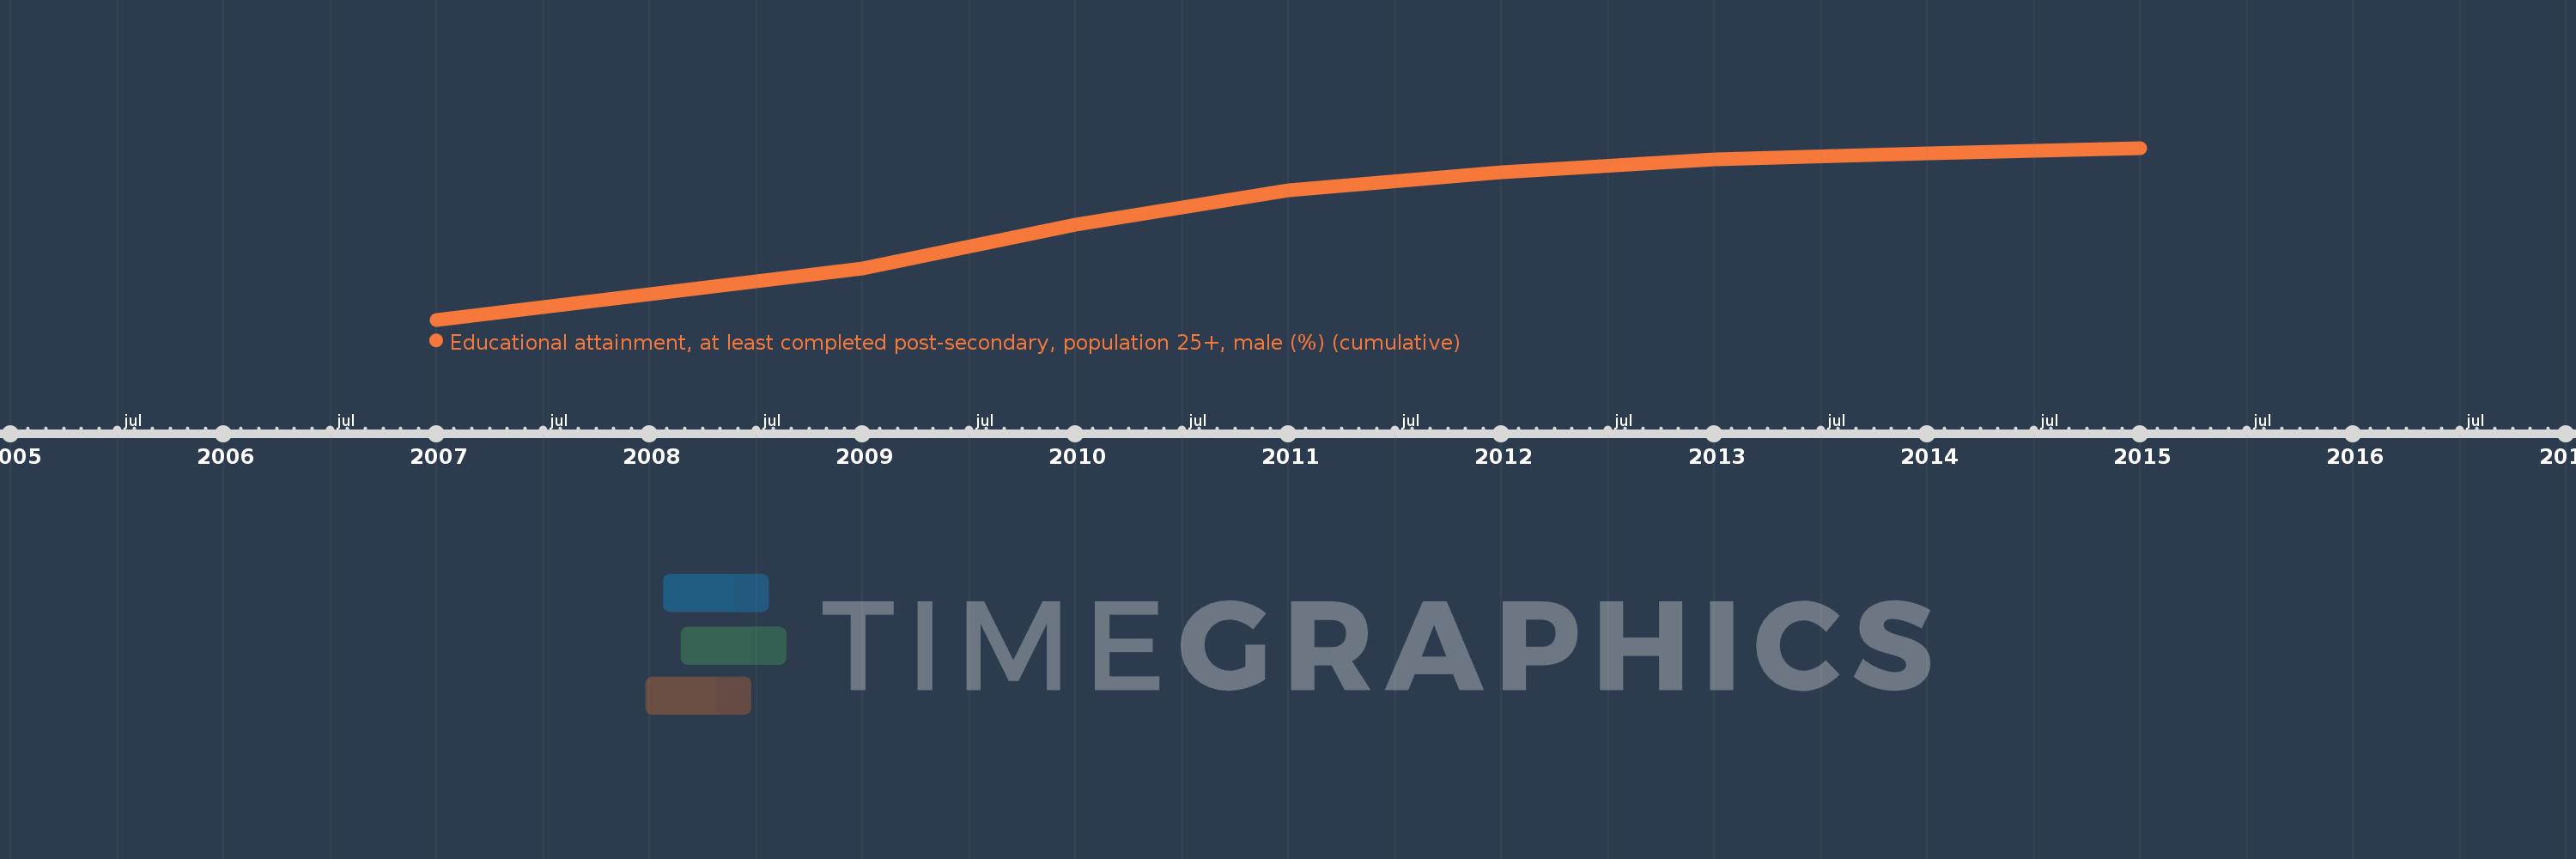
Educational attainment, at least completed post-secondary, population 25+, male (%) (cumulative)
2015,2014,2013,2012,2011,2010,2009,2007
This statistics in other country:
Timeline:
This timeline shows a graph from 2007 to 2015 of Belgium. No data until 2006. Number of actual observations by date: 8.
Source name:
World Development Indicators
Source organization:
United Nations Educational, Scientific, and Cultural Organization (UNESCO) Institute for Statistics.
Categories, topics:
Education, Gender
Last updated:
apr 23, 2017
Indicators value changes by year
Minimum:
28.445
jan 1, 2007
Maximum:
32.884
jan 1, 2015
At the date of observation
Value
Absolute change
Change from previous value
jan 1, 2007
28.445
+28.445
0.0%
jan 1, 2009
29.763
+1.317
4.63%
jan 1, 2010
30.906
+1.144
3.84%
jan 1, 2011
31.783
+0.877
2.84%
jan 1, 2012
32.261
+0.477
1.5%
jan 1, 2013
32.599
+0.338
1.05%
jan 1, 2014
32.736
+0.138
0.42%
jan 1, 2015
32.884
+0.148
0.45%
Ranking of countries by current statistics by years


Comments: