29
/
en
AIzaSyAYiBZKx7MnpbEhh9jyipgxe19OcubqV5w
April 1, 2024
81080
Belarus
BLR
true
2
1
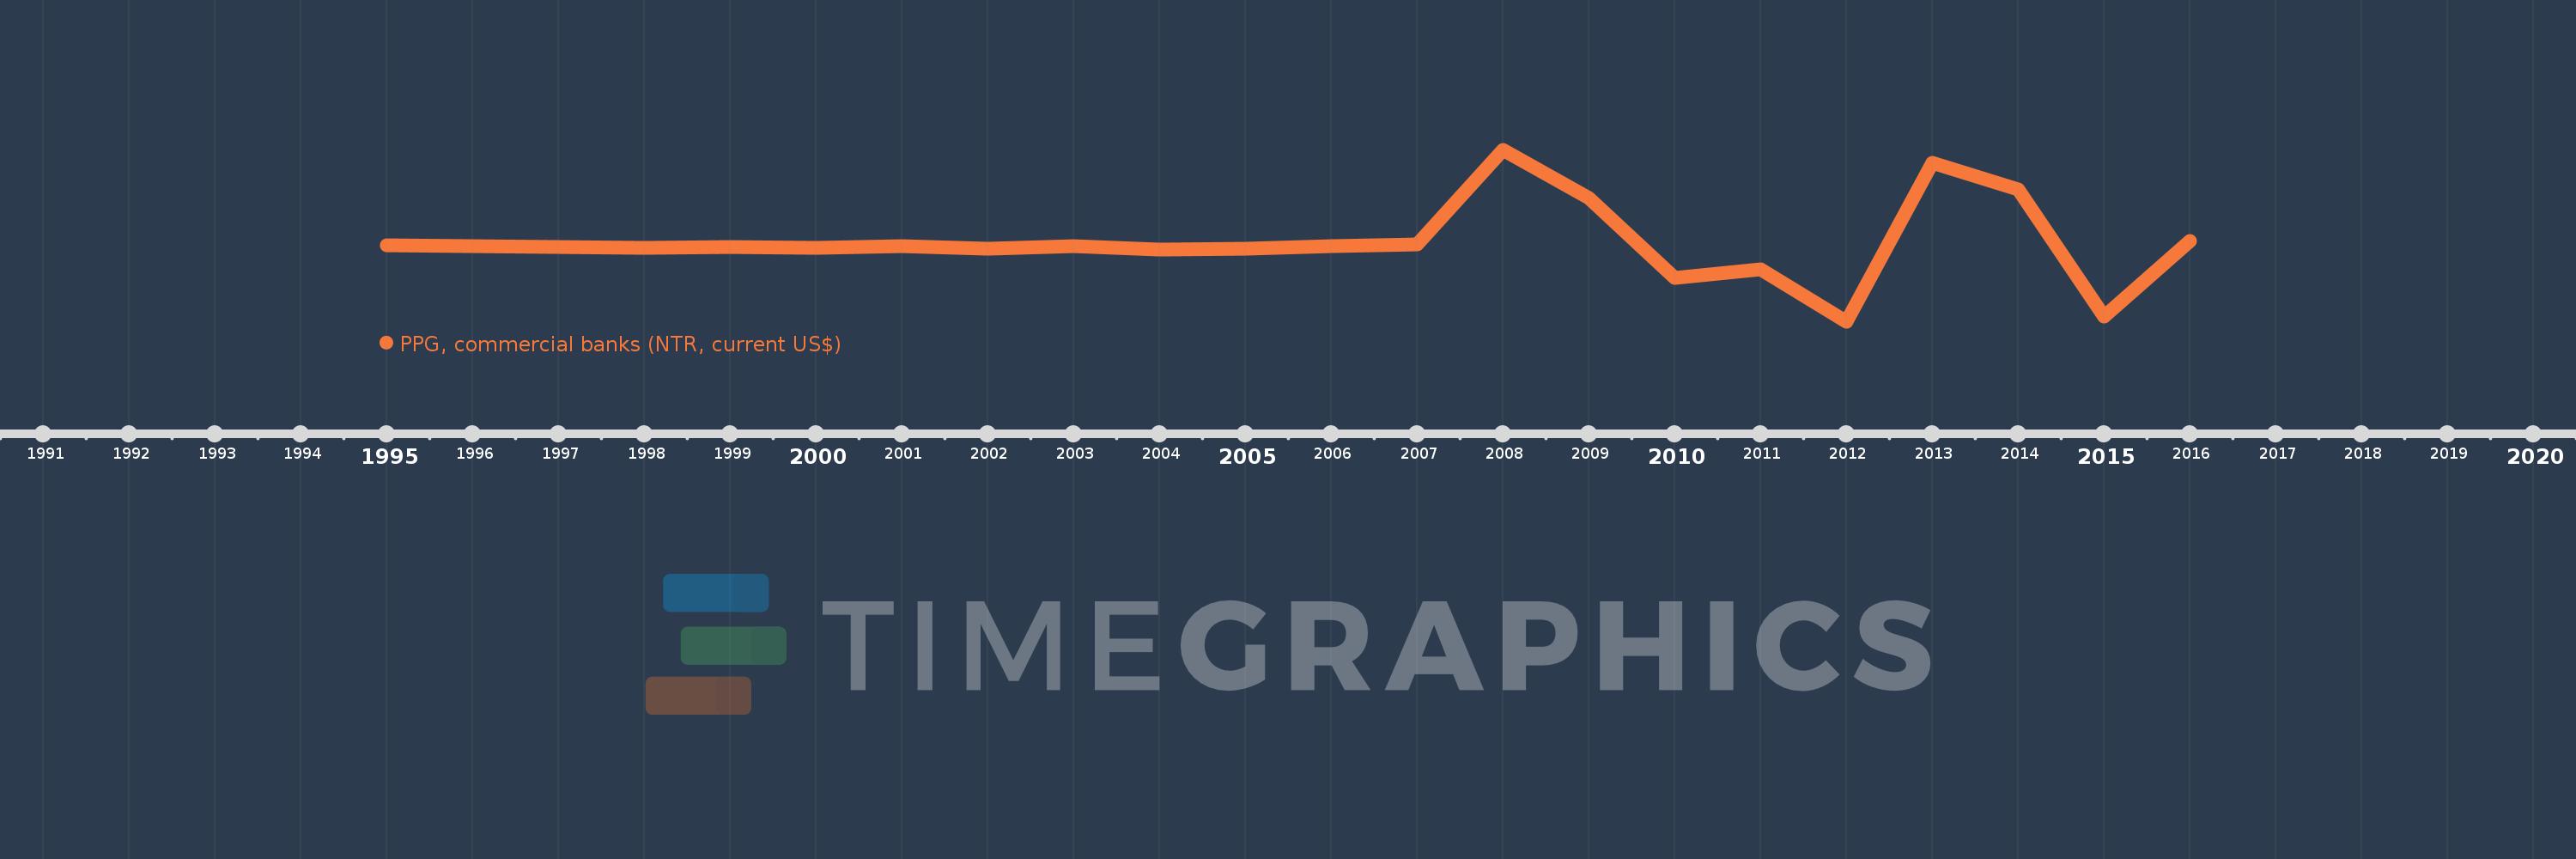
PPG, commercial banks (NTR, current US$)
2016,2015,2014,2013,2012,2011,2010,2009,2008,2007,2006,2005,2004,2003,2002,2001,2000,1999,1998,1997,1996,1995
This statistics in other country:
Timeline:
This timeline shows a graph from 1995 to 2016 of Belarus. No data until 1994. Number of actual observations by date: 22.
Source name:
World Development Indicators
Source organization:
World Bank, International Debt Statistics.
Categories, topics:
External Debt
Last updated:
apr 23, 2017
Indicators value changes by year
Minimum:
-831.234 mln
jan 1, 2012
Maximum:
1.087 bln
jan 1, 2008
At the date of observation
Value
Absolute change
Change from previous value
jan 1, 1995
22.939 mln
+22.939 mln
0.0%
jan 1, 1996
18.592 mln
-4.347 mln
-18.95%
jan 1, 1997
4.963 mln
-13.629 mln
-73.31%
jan 1, 1998
-2.775 mln
-7.738 mln
-155.91%
jan 1, 1999
7.485 mln
+10.26 mln
-369.73%
jan 1, 2000
-7.575 mln
-15.06 mln
-201.2%
jan 1, 2001
15.688 mln
+23.263 mln
-307.1%
jan 1, 2002
-10.896 mln
-26.584 mln
-169.45%
jan 1, 2003
10.824 mln
+21.72 mln
-199.34%
jan 1, 2004
-21.627 mln
-32.451 mln
-299.81%
jan 1, 2005
-16.001 mln
+5.626 mln
-26.01%
jan 1, 2006
17.518 mln
+33.519 mln
-209.48%
jan 1, 2007
34.4 mln
+16.882 mln
96.37%
jan 1, 2008
1.087 bln
+1.052 bln
3.06K%
jan 1, 2009
551.295 mln
-535.545 mln
-49.28%
jan 1, 2010
-335.686 mln
-886.981 mln
-160.89%
jan 1, 2011
-241.832 mln
+93.854 mln
-27.96%
jan 1, 2012
-831.234 mln
-589.402 mln
243.72%
jan 1, 2013
946.622 mln
+1.778 bln
-213.88%
jan 1, 2014
653.326 mln
-293.296 mln
-30.98%
jan 1, 2015
-774.335 mln
-1.428 bln
-218.52%
jan 1, 2016
72.645 mln
+846.98 mln
-109.38%
Ranking of countries by current statistics by years


Comments: