29
/
en
AIzaSyAYiBZKx7MnpbEhh9jyipgxe19OcubqV5w
April 1, 2024
76016
Bahamas, The
BHS
true
2
1
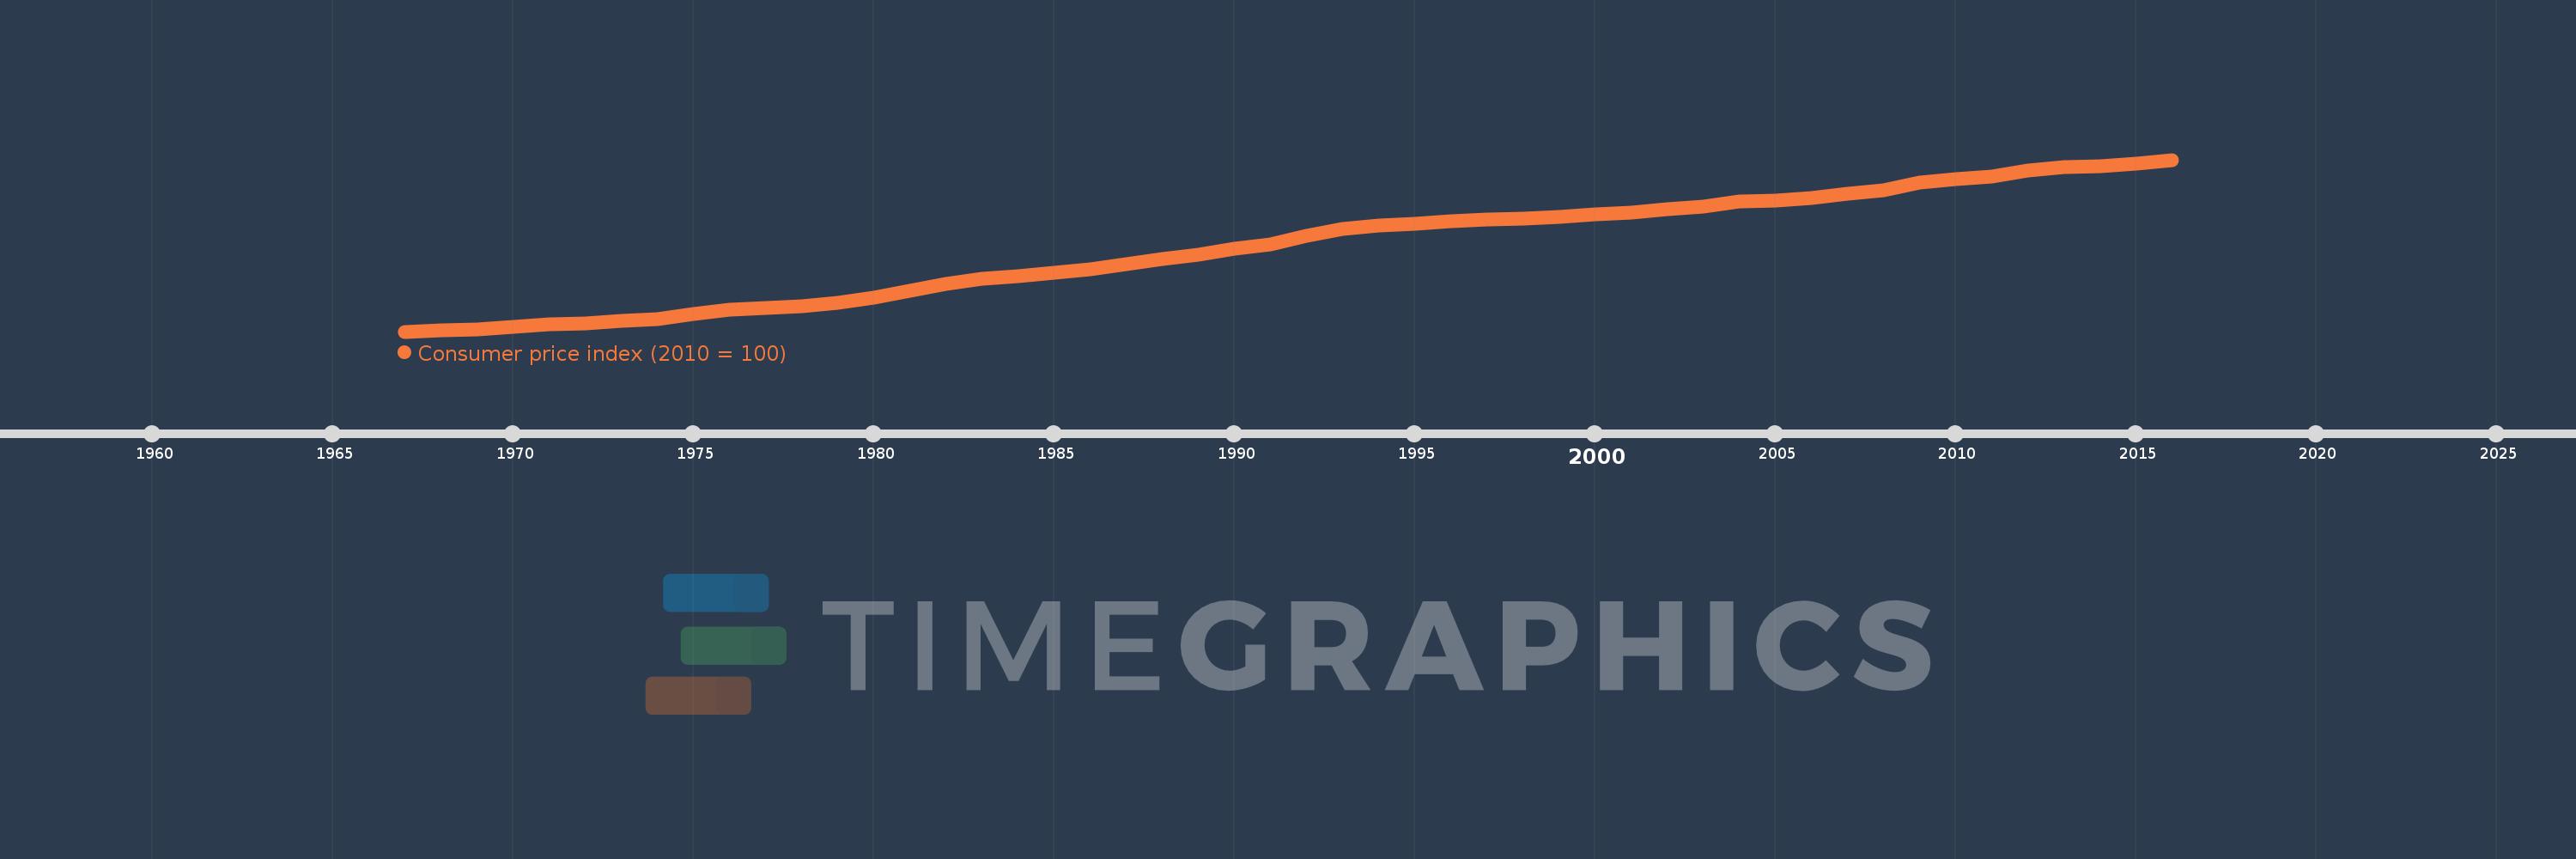
Consumer price index (2010 = 100)
2016,2015,2014,2013,2012,2011,2010,2009,2008,2007,2006,2005,2004,2003,2002,2001,2000,1999,1998,1997,1996,1995,1994,1993,1992,1991,1990,1989,1988,1987,1986,1985,1984,1983,1982,1981,1980,1979,1978,1977,1976,1975,1974,1973,1972,1971,1970,1969,1968,1967
This statistics in other country:
AfghanistanAlbaniaAlgeriaAngolaAntigua and BarbudaArgentinaArmeniaArubaAustraliaAustriaBahamas, TheBahrainBangladeshBarbadosBelgiumBelizeBeninBhutanBoliviaBosnia and HerzegovinaBotswanaBrazilBrunei DarussalamBulgariaBurkina FasoBurundiCabo VerdeCambodiaCameroonCanadaCentral African RepublicChadChileChinaColombiaComorosCongo, Dem. Rep.Congo, Rep.Costa RicaCote d'IvoireCroatiaCuracaoCyprusCzech RepublicDenmarkDjiboutiDominicaDominican RepublicEcuadorEgypt, Arab Rep.El SalvadorEquatorial GuineaEstoniaEthiopiaFijiFinlandFranceGabonGambia, TheGeorgiaGermanyGhanaGreeceGrenadaGuatemalaGuineaGuinea-BissauGuyanaHaitiHondurasHong Kong SAR, ChinaHungaryIcelandIndiaIndonesiaIran, Islamic Rep.IraqIrelandIsraelItalyJamaicaJapanJordanKazakhstanKenyaKorea, Rep.KosovoKuwaitKyrgyz RepublicLao PDRLatviaLebanonLesothoLiberiaLibyaLithuaniaLuxembourgMacao SAR, ChinaMacedonia, FYRMadagascarMalawiMalaysiaMaldivesMaliMaltaMauritaniaMauritiusMexicoMoldovaMongoliaMontenegroMoroccoMozambiqueMyanmarNamibiaNepalNetherlandsNew ZealandNicaraguaNigerNigeriaNorwayOmanPakistanPanamaPapua New GuineaParaguayPeruPhilippinesPolandPortugalQatarRomaniaRussian FederationRwandaSamoaSan MarinoSao Tome and PrincipeSaudi ArabiaSenegalSerbiaSeychellesSierra LeoneSingaporeSint Maarten (Dutch part)Slovak RepublicSloveniaSolomon IslandsSouth AfricaSouth SudanSpainSri LankaSt. Kitts and NevisSt. LuciaSt. Vincent and the GrenadinesSudanSurinameSwazilandSwedenSwitzerlandSyrian Arab RepublicTanzaniaThailandTimor-LesteTogoTongaTrinidad and TobagoTunisiaTurkeyUgandaUkraineUnited Arab EmiratesUnited KingdomUnited StatesUruguayVanuatuVenezuela, RBVietnamWest Bank and GazaYemen, Rep.ZambiaZimbabwe Timeline:
This timeline shows a graph from 1967 to 2016 of Bahamas, The. No data until 1966. Number of actual observations by date: 50.
Source name:
World Development Indicators
Source organization:
International Monetary Fund, International Financial Statistics and data files.
Categories, topics:
Financial Sector
Last updated:
apr 23, 2017
Indicators value changes by year
Minimum:
13.962
jan 1, 1967
Maximum:
109.206
jan 1, 2016
At the date of observation
Value
Absolute change
Change from previous value
jan 1, 1967
13.962
+13.962
0.0%
jan 1, 1968
14.722
+0.759
5.44%
jan 1, 1969
15.39
+0.669
4.54%
jan 1, 1970
16.765
+1.375
8.94%
jan 1, 1971
17.797
+1.031
6.15%
jan 1, 1972
18.618
+0.821
4.61%
jan 1, 1973
19.89
+1.272
6.83%
jan 1, 1974
20.98
+1.09
5.48%
jan 1, 1975
23.723
+2.742
13.07%
jan 1, 1976
26.18
+2.458
10.36%
jan 1, 1977
27.294
+1.114
4.26%
jan 1, 1978
28.165
+0.871
3.19%
jan 1, 1979
29.886
+1.721
6.11%
jan 1, 1980
32.603
+2.717
9.09%
jan 1, 1981
36.547
+3.944
12.1%
jan 1, 1982
40.609
+4.062
11.11%
jan 1, 1983
43.051
+2.442
6.01%
jan 1, 1984
44.773
+1.722
4.0%
jan 1, 1985
46.548
+1.776
3.97%
jan 1, 1986
48.692
+2.144
4.61%
jan 1, 1987
51.338
+2.646
5.43%
jan 1, 1988
54.293
+2.955
5.76%
jan 1, 1989
56.683
+2.39
4.4%
jan 1, 1990
59.737
+3.054
5.39%
jan 1, 1991
62.526
+2.789
4.67%
jan 1, 1992
66.975
+4.449
7.11%
jan 1, 1993
70.818
+3.843
5.74%
jan 1, 1994
72.746
+1.928
2.72%
jan 1, 1995
73.764
+1.018
1.4%
jan 1, 1996
75.289
+1.525
2.07%
jan 1, 1997
76.327
+1.038
1.38%
jan 1, 1998
76.743
+0.415
0.54%
jan 1, 1999
77.769
+1.026
1.34%
jan 1, 2000
78.744
+0.975
1.25%
jan 1, 2001
80.009
+1.265
1.61%
jan 1, 2002
81.645
+1.636
2.04%
jan 1, 2003
83.42
+1.775
2.17%
jan 1, 2004
85.943
+2.523
3.03%
jan 1, 2005
86.787
+0.844
0.98%
jan 1, 2006
88.168
+1.381
1.59%
jan 1, 2007
90.275
+2.107
2.39%
jan 1, 2008
92.526
+2.25
2.49%
jan 1, 2009
96.68
+4.154
4.49%
jan 1, 2010
98.674
+1.994
2.06%
jan 1, 2011
100.0
+1.326
1.34%
jan 1, 2012
103.199
+3.199
3.2%
jan 1, 2013
105.247
+2.048
1.98%
jan 1, 2014
105.612
+0.365
0.35%
jan 1, 2015
107.201
+1.589
1.5%
jan 1, 2016
109.206
+2.006
1.87%
Ranking of countries by current statistics by years


Comments: