29
/
en
AIzaSyAYiBZKx7MnpbEhh9jyipgxe19OcubqV5w
April 1, 2024
74883
Azerbaijan
AZE
true
2
1
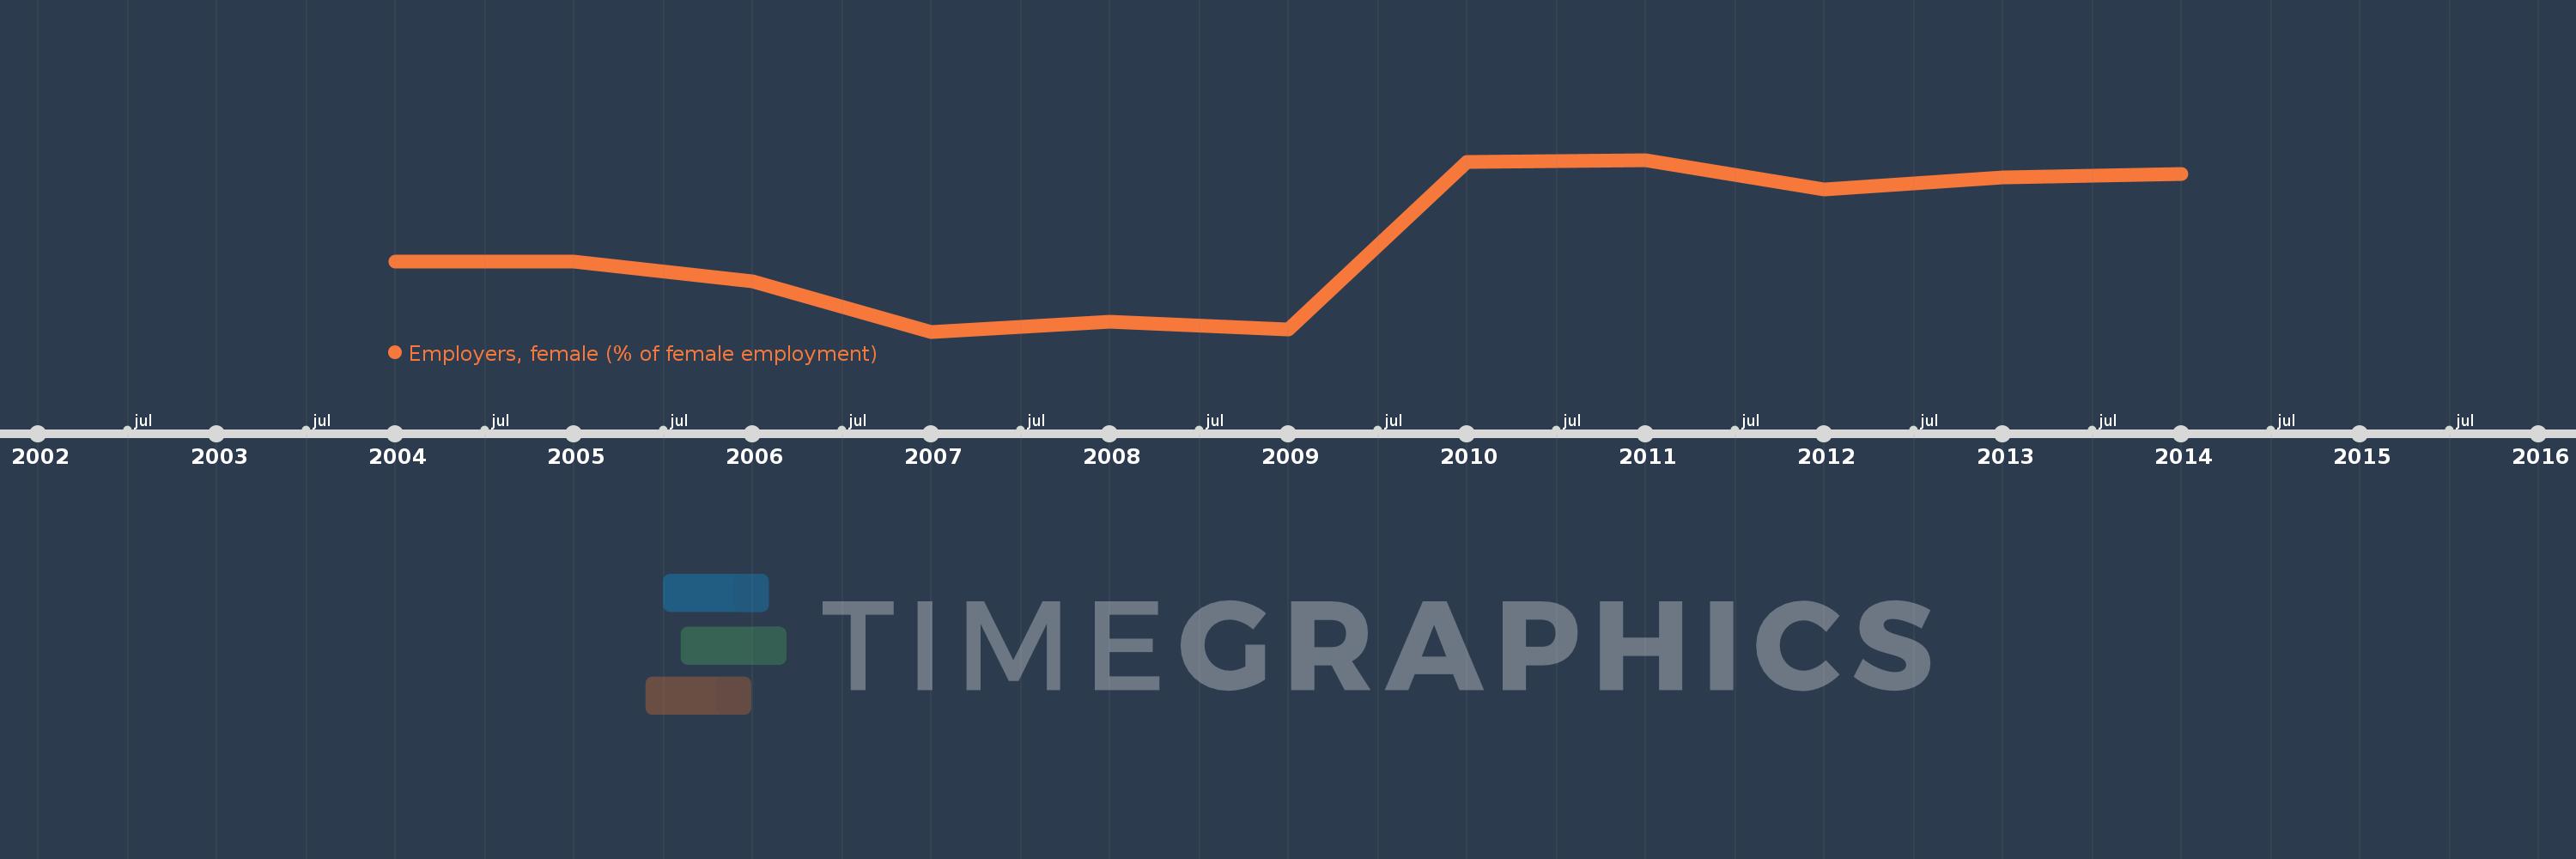
Employers, female (% of female employment)
2014,2013,2012,2011,2010,2009,2008,2007,2006,2005,2004
This statistics in other country:
Timeline:
This timeline shows a graph from 2004 to 2014 of Azerbaijan. No data until 2003. Number of actual observations by date: 11.
Source name:
World Development Indicators
Source organization:
ILO Key Indicators of the Labour Market (KILM).
Categories, topics:
Social Protection & Labor, Gender
Last updated:
apr 23, 2017
Indicators value changes by year
At the date of observation
Value
Absolute change
Change from previous value
jan 1, 2006
3.3
-1.0
-23.26%
jan 1, 2007
0.8
-2.5
-75.76%
jan 1, 2008
1.3
+0.5
62.5%
jan 1, 2009
0.9
-0.4
-30.77%
jan 1, 2010
9.3
+8.4
933.33%
jan 1, 2011
9.4
+0.1
1.08%
jan 1, 2012
7.9
-1.5
-15.96%
jan 1, 2013
8.5
+0.6
7.59%
jan 1, 2014
8.7
+0.2
2.35%
Ranking of countries by current statistics by years


Comments: