29
/
en
AIzaSyAYiBZKx7MnpbEhh9jyipgxe19OcubqV5w
April 1, 2024
74836
Azerbaijan
AZE
true
2
1
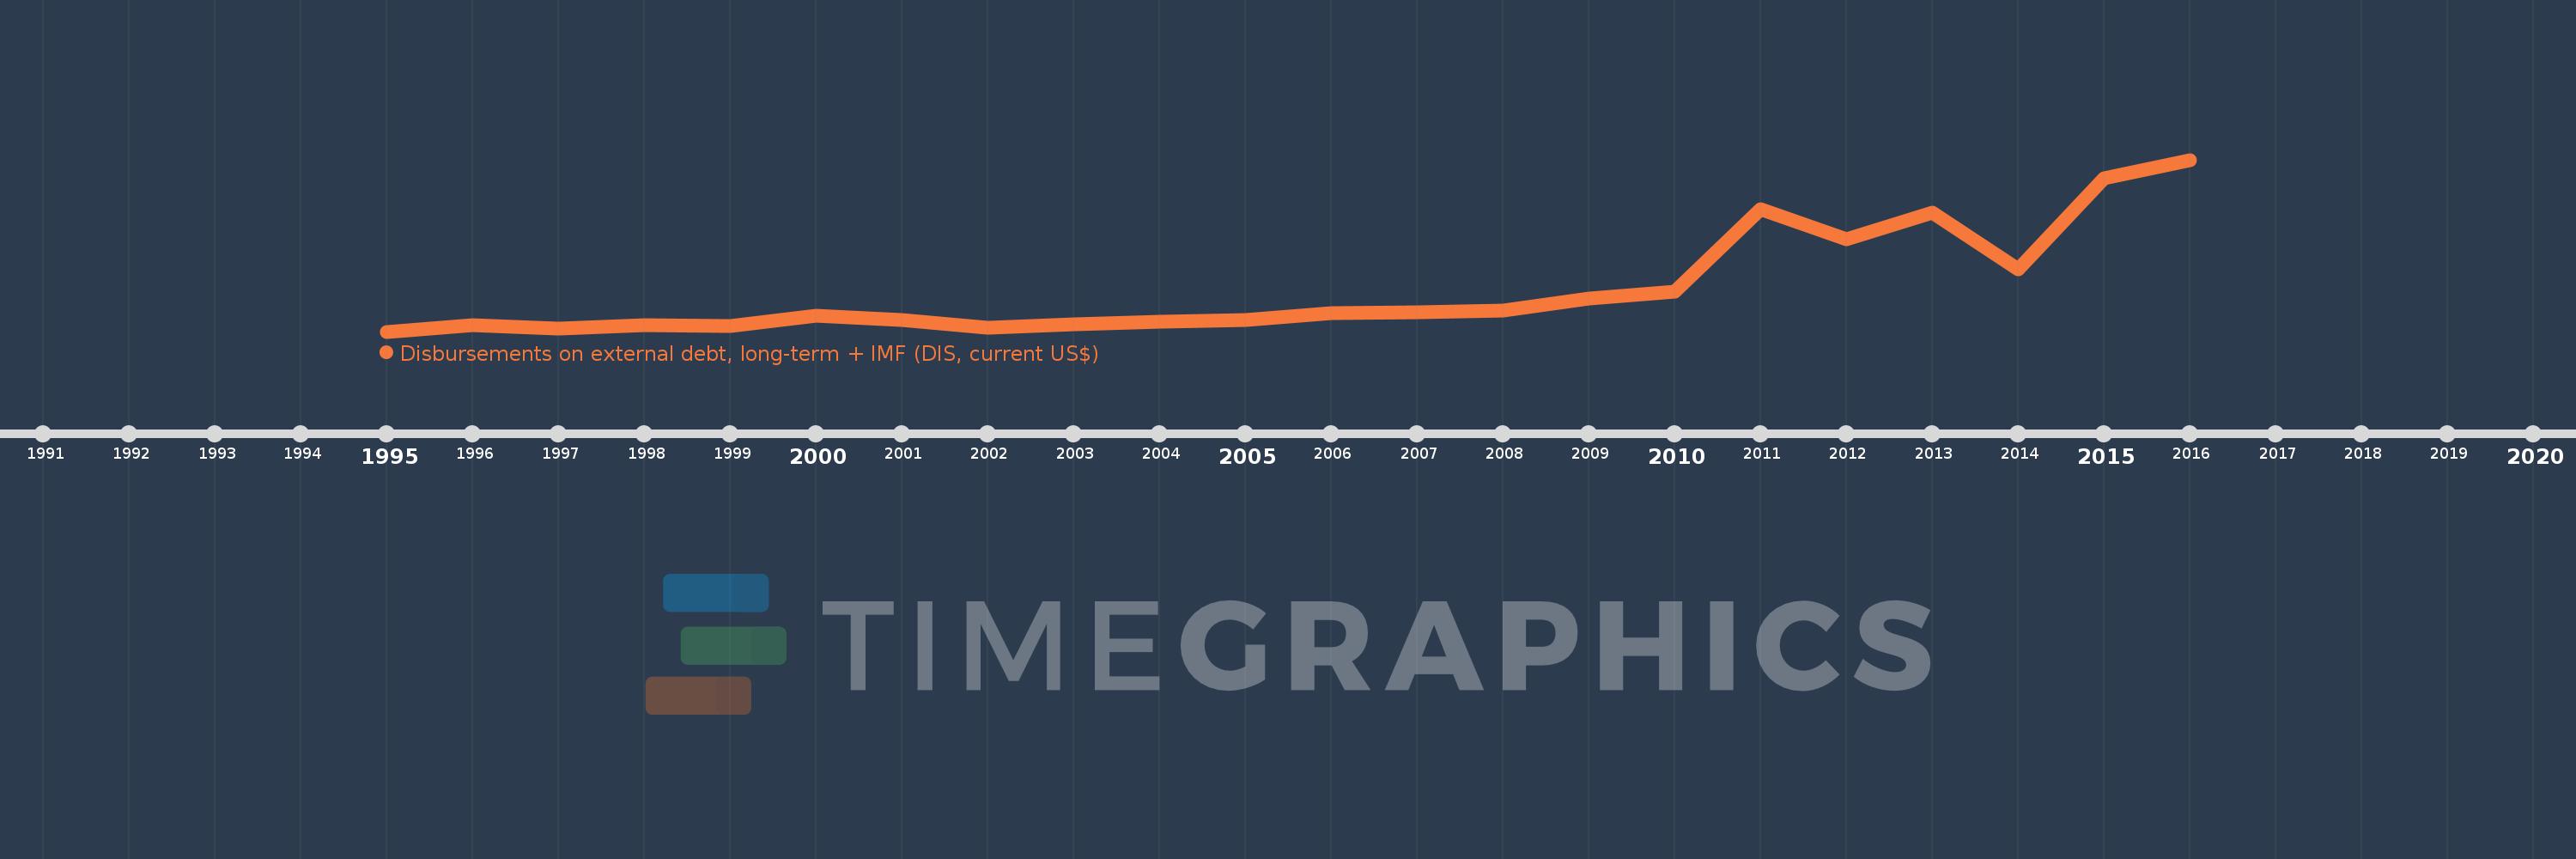
Disbursements on external debt, long-term + IMF (DIS, current US$)
2016,2015,2014,2013,2012,2011,2010,2009,2008,2007,2006,2005,2004,2003,2002,2001,2000,1999,1998,1997,1996,1995
This statistics in other country:
Timeline:
This timeline shows a graph from 1995 to 2016 of Azerbaijan. No data until 1994. Number of actual observations by date: 22.
Source name:
World Development Indicators
Source organization:
World Bank, International Debt Statistics.
Categories, topics:
External Debt
Last updated:
apr 23, 2017
Indicators value changes by year
Minimum:
67.415 mln
jan 1, 1995
Maximum:
3.556 bln
jan 1, 2016
At the date of observation
Value
Absolute change
Change from previous value
jan 1, 1995
67.415 mln
+67.415 mln
0.0%
jan 1, 1996
205.018 mln
+137.603 mln
204.11%
jan 1, 1997
124.694 mln
-80.324 mln
-39.18%
jan 1, 1998
197.424 mln
+72.73 mln
58.33%
jan 1, 1999
181.035 mln
-16.389 mln
-8.3%
jan 1, 2000
394.679 mln
+213.644 mln
118.01%
jan 1, 2001
306.082 mln
-88.597 mln
-22.45%
jan 1, 2002
139.346 mln
-166.736 mln
-54.47%
jan 1, 2003
216.247 mln
+76.901 mln
55.19%
jan 1, 2004
266.354 mln
+50.107 mln
23.17%
jan 1, 2005
309.191 mln
+42.837 mln
16.08%
jan 1, 2006
450.643 mln
+141.452 mln
45.75%
jan 1, 2007
468.051 mln
+17.408 mln
3.86%
jan 1, 2008
488.604 mln
+20.553 mln
4.39%
jan 1, 2009
741.279 mln
+252.675 mln
51.71%
jan 1, 2010
870.039 mln
+128.76 mln
17.37%
jan 1, 2011
2.547 bln
+1.677 bln
192.78%
jan 1, 2012
1.941 bln
-606.5 mln
-23.81%
jan 1, 2013
2.477 bln
+536.049 mln
27.62%
jan 1, 2014
1.327 bln
-1.15 bln
-46.43%
jan 1, 2015
3.178 bln
+1.851 bln
139.51%
jan 1, 2016
3.556 bln
+378.246 mln
11.9%
Ranking of countries by current statistics by years


Comments: