29
/
en
AIzaSyAYiBZKx7MnpbEhh9jyipgxe19OcubqV5w
April 1, 2024
74297
Austria
AUT
true
2
1
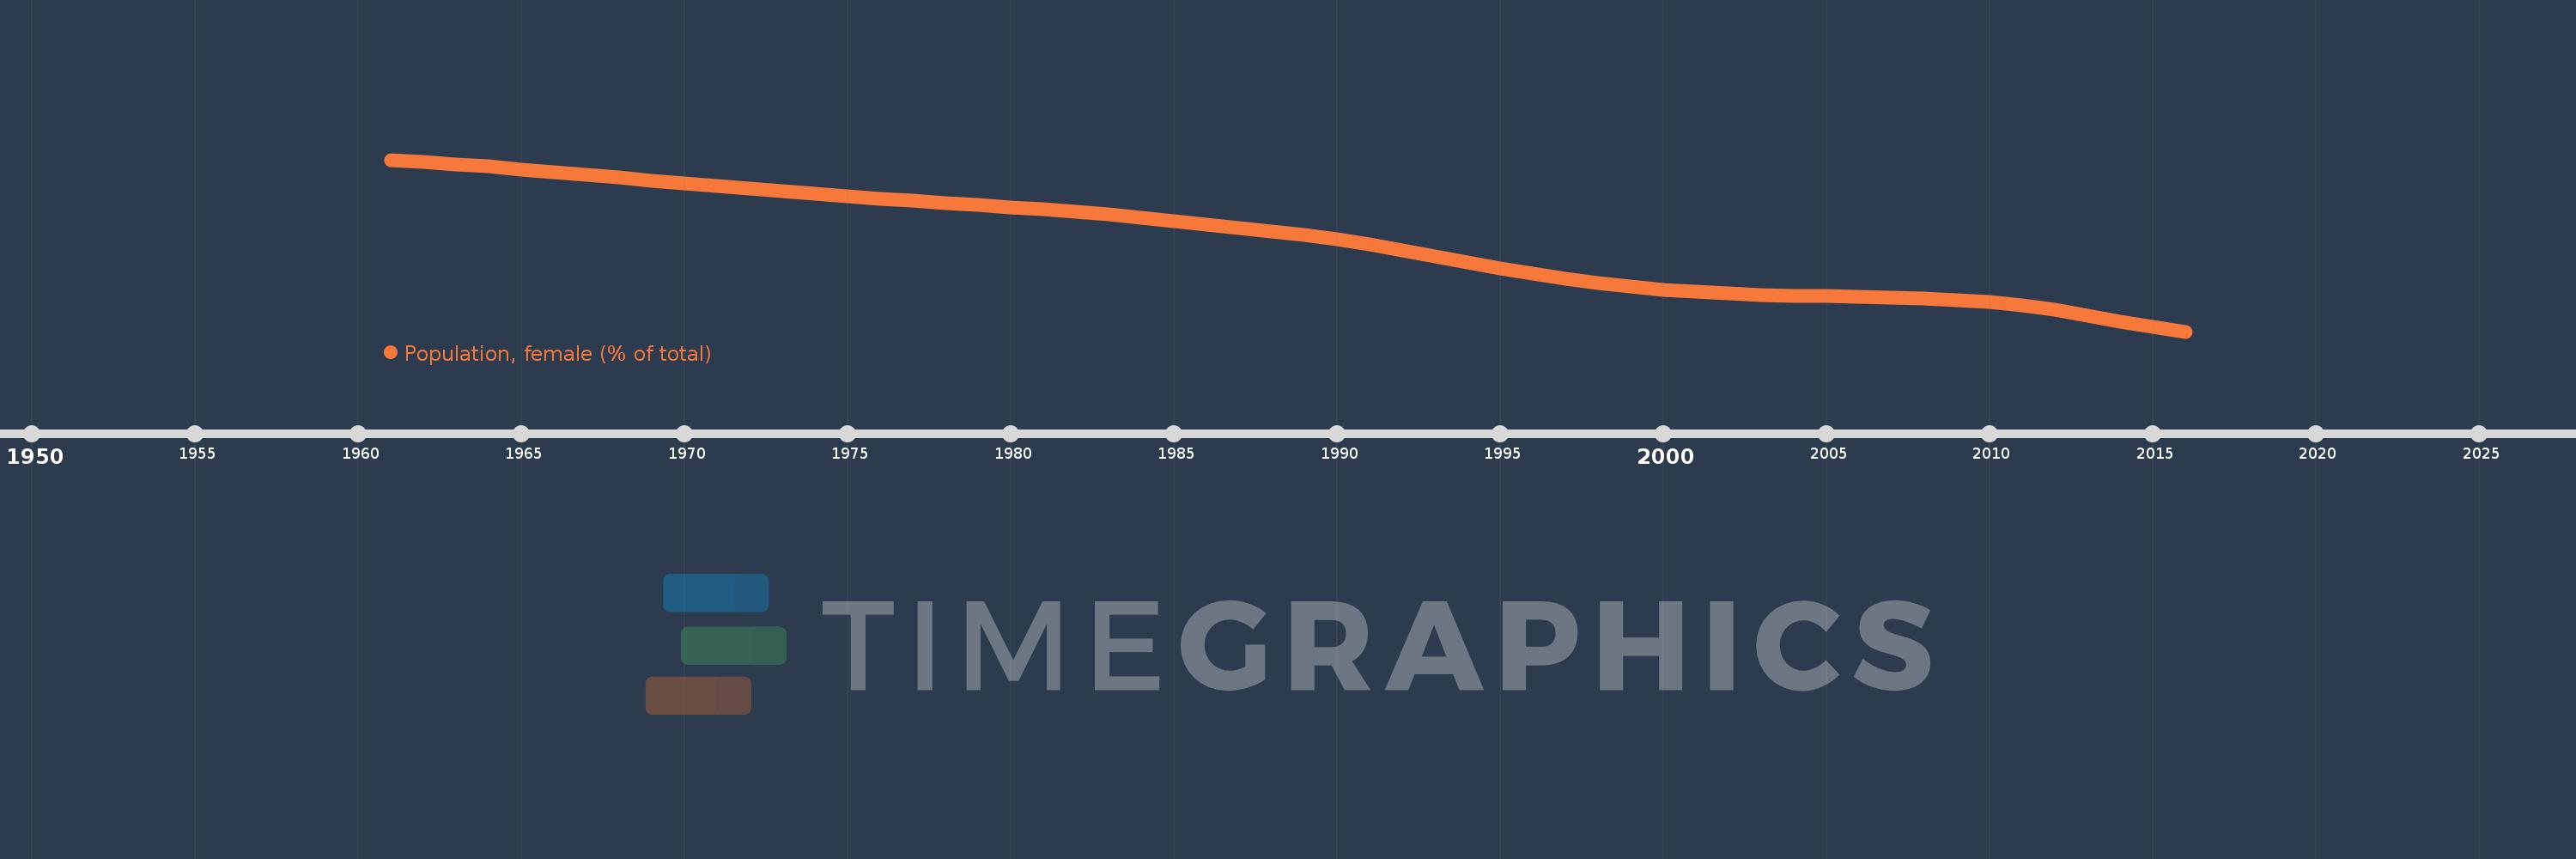
Population, female (% of total)
2016,2015,2014,2013,2012,2011,2010,2009,2008,2007,2006,2005,2004,2003,2002,2001,2000,1999,1998,1997,1996,1995,1994,1993,1992,1991,1990,1989,1988,1987,1986,1985,1984,1983,1982,1981,1980,1979,1978,1977,1976,1975,1974,1973,1972,1971,1970,1969,1968,1967,1966,1965,1964,1963,1962,1961
This statistics in other country:
AfghanistanAlbaniaAlgeriaAngolaAntigua and BarbudaArab WorldArgentinaArmeniaArubaAustraliaAustriaAzerbaijanBahamas, TheBahrainBangladeshBarbadosBelarusBelgiumBelizeBeninBhutanBoliviaBosnia and HerzegovinaBotswanaBrazilBrunei DarussalamBulgariaBurkina FasoBurundiCabo VerdeCambodiaCameroonCanadaCaribbean small statesCentral African RepublicCentral Europe and the BalticsChadChannel IslandsChileChinaColombiaComorosCongo, Dem. Rep.Congo, Rep.Costa RicaCote d'IvoireCroatiaCubaCuracaoCyprusCzech RepublicDenmarkDjiboutiDominican RepublicEarly-demographic dividendEast Asia & PacificEast Asia & Pacific (excluding high income)East Asia & Pacific (IDA & IBRD countries)EcuadorEgypt, Arab Rep.El SalvadorEquatorial GuineaEritreaEstoniaEthiopiaEuro areaEurope & Central AsiaEurope & Central Asia (excluding high income)Europe & Central Asia (IDA & IBRD countries)European UnionFijiFinlandFragile and conflict affected situationsFranceFrench PolynesiaGabonGambia, TheGeorgiaGermanyGhanaGreeceGrenadaGuamGuatemalaGuineaGuinea-BissauGuyanaHaitiHeavily indebted poor countries (HIPC)High incomeHondurasHong Kong SAR, ChinaHungaryIBRD onlyIcelandIDA & IBRD totalIDA blendIDA onlyIDA totalIndiaIndonesiaIran, Islamic Rep.IraqIrelandIsraelItalyJamaicaJapanJordanKazakhstanKenyaKiribatiKorea, Dem. People’s Rep.Korea, Rep.KosovoKuwaitKyrgyz RepublicLao PDRLate-demographic dividendLatin America & Caribbean Latin America & Caribbean (excluding high income)Latin America & the Caribbean (IDA & IBRD countries)LatviaLeast developed countries: UN classificationLebanonLesothoLiberiaLibyaLithuaniaLow & middle incomeLow incomeLower middle incomeLuxembourgMacao SAR, ChinaMacedonia, FYRMadagascarMalawiMalaysiaMaldivesMaliMaltaMauritaniaMauritiusMexicoMicronesia, Fed. Sts.Middle East & North AfricaMiddle East & North Africa (excluding high income)Middle East & North Africa (IDA & IBRD countries)Middle incomeMoldovaMongoliaMontenegroMoroccoMozambiqueMyanmarNamibiaNepalNetherlandsNew CaledoniaNew ZealandNicaraguaNigerNigeriaNorth AmericaNorwayOECD membersOmanOther small statesPacific island small statesPakistanPanamaPapua New GuineaParaguayPeruPhilippinesPolandPortugalPost-demographic dividendPre-demographic dividendPuerto RicoQatarRomaniaRussian FederationRwandaSamoaSao Tome and PrincipeSaudi ArabiaSenegalSerbiaSeychellesSierra LeoneSingaporeSlovak RepublicSloveniaSmall statesSolomon IslandsSomaliaSouth AfricaSouth AsiaSouth Asia (IDA & IBRD)South SudanSpainSri LankaSt. LuciaSt. Vincent and the GrenadinesSub-Saharan Africa Sub-Saharan Africa (excluding high income)Sub-Saharan Africa (IDA & IBRD countries)SudanSurinameSwazilandSwedenSwitzerlandSyrian Arab RepublicTajikistanTanzaniaThailandTimor-LesteTogoTongaTrinidad and TobagoTunisiaTurkeyTurkmenistanUgandaUkraineUnited Arab EmiratesUnited KingdomUnited StatesUpper middle incomeUruguayUzbekistanVanuatuVenezuela, RBVietnamVirgin Islands (U.S.)West Bank and GazaWorldYemen, Rep.ZambiaZimbabwe Timeline:
This timeline shows a graph from 1961 to 2016 of Austria. No data until 1960. Number of actual observations by date: 56.
Source name:
World Development Indicators
Source organization:
World Bank staff estimates based on male/female distributions of United Nations Population Division's World Population Prospects.
Categories, topics:
Health
Last updated:
apr 23, 2017
Indicators value changes by year
Minimum:
50.889
jan 1, 2016
Maximum:
53.409
jan 1, 1961
At the date of observation
Value
Absolute change
Change from previous value
jan 1, 1961
53.409
+53.409
0.0%
jan 1, 1962
53.378
-0.031
-0.06%
jan 1, 1963
53.345
-0.034
-0.06%
jan 1, 1964
53.309
-0.036
-0.07%
jan 1, 1965
53.27
-0.038
-0.07%
jan 1, 1966
53.231
-0.04
-0.07%
jan 1, 1967
53.19
-0.041
-0.08%
jan 1, 1968
53.148
-0.042
-0.08%
jan 1, 1969
53.106
-0.042
-0.08%
jan 1, 1970
53.064
-0.042
-0.08%
jan 1, 1971
53.023
-0.041
-0.08%
jan 1, 1972
52.983
-0.04
-0.08%
jan 1, 1973
52.944
-0.039
-0.07%
jan 1, 1974
52.906
-0.037
-0.07%
jan 1, 1975
52.871
-0.036
-0.07%
jan 1, 1976
52.837
-0.033
-0.06%
jan 1, 1977
52.806
-0.031
-0.06%
jan 1, 1978
52.776
-0.03
-0.06%
jan 1, 1979
52.747
-0.029
-0.06%
jan 1, 1980
52.716
-0.031
-0.06%
jan 1, 1981
52.682
-0.034
-0.06%
jan 1, 1982
52.644
-0.038
-0.07%
jan 1, 1983
52.603
-0.041
-0.08%
jan 1, 1984
52.558
-0.045
-0.09%
jan 1, 1985
52.511
-0.047
-0.09%
jan 1, 1986
52.461
-0.049
-0.09%
jan 1, 1987
52.411
-0.05
-0.1%
jan 1, 1988
52.359
-0.052
-0.1%
jan 1, 1989
52.303
-0.056
-0.11%
jan 1, 1990
52.239
-0.064
-0.12%
jan 1, 1991
52.166
-0.073
-0.14%
jan 1, 1992
52.083
-0.083
-0.16%
jan 1, 1993
51.993
-0.09
-0.17%
jan 1, 1994
51.901
-0.092
-0.18%
jan 1, 1995
51.813
-0.088
-0.17%
jan 1, 1996
51.734
-0.079
-0.15%
jan 1, 1997
51.664
-0.07
-0.14%
jan 1, 1998
51.602
-0.062
-0.12%
jan 1, 1999
51.549
-0.053
-0.1%
jan 1, 2000
51.505
-0.044
-0.09%
jan 1, 2001
51.47
-0.035
-0.07%
jan 1, 2002
51.445
-0.025
-0.05%
jan 1, 2003
51.428
-0.017
-0.03%
jan 1, 2004
51.417
-0.011
-0.02%
jan 1, 2005
51.408
-0.009
-0.02%
jan 1, 2006
51.398
-0.011
-0.02%
jan 1, 2007
51.386
-0.012
-0.02%
jan 1, 2008
51.373
-0.013
-0.03%
jan 1, 2009
51.353
-0.02
-0.04%
jan 1, 2010
51.32
-0.032
-0.06%
jan 1, 2011
51.272
-0.048
-0.09%
jan 1, 2012
51.206
-0.066
-0.13%
jan 1, 2013
51.124
-0.082
-0.16%
jan 1, 2014
51.036
-0.088
-0.17%
jan 1, 2015
50.955
-0.081
-0.16%
jan 1, 2016
50.889
-0.066
-0.13%
Ranking of countries by current statistics by years


Comments: