29
/
en
AIzaSyAYiBZKx7MnpbEhh9jyipgxe19OcubqV5w
April 1, 2024
74262
Austria
AUT
true
2
1
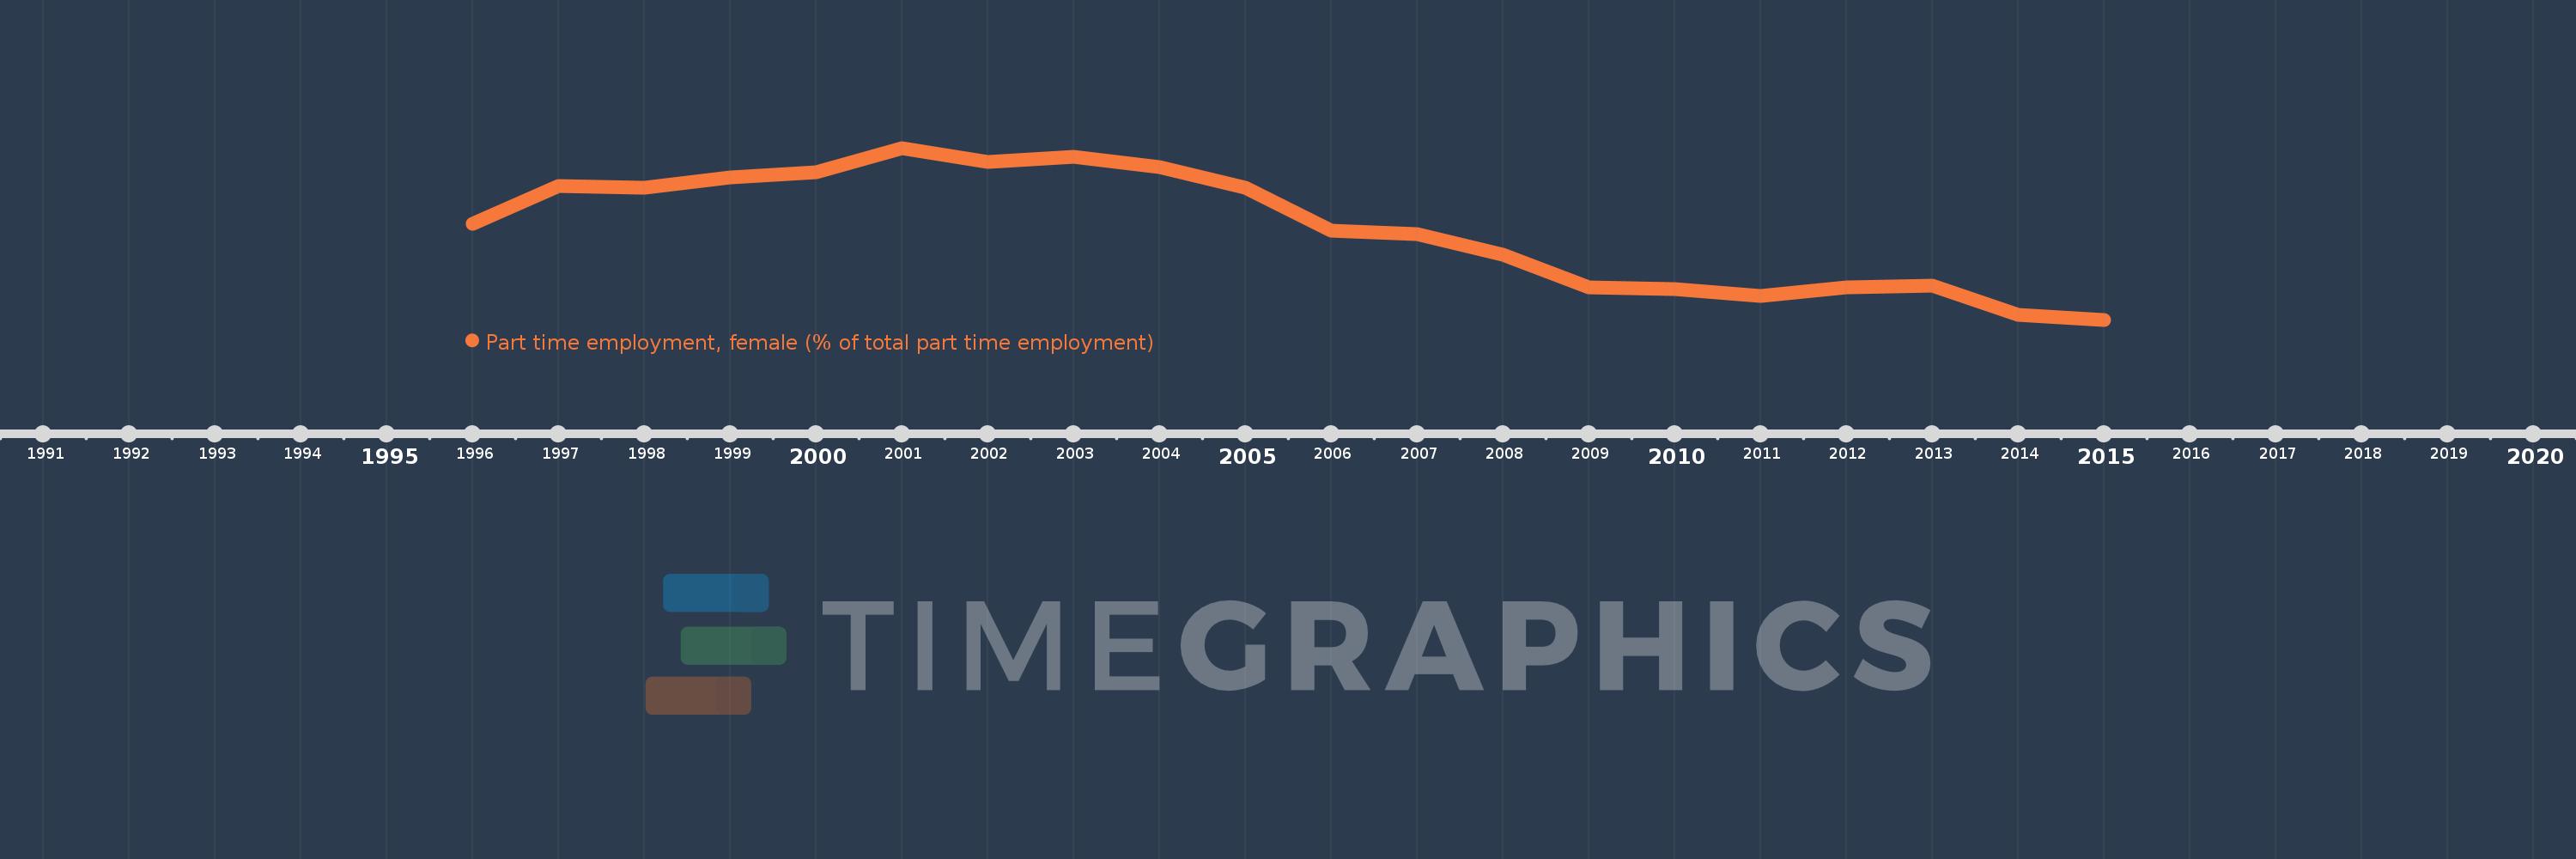
Part time employment, female (% of total part time employment)
2015,2014,2013,2012,2011,2010,2009,2008,2007,2006,2005,2004,2003,2002,2001,2000,1999,1998,1997,1996
This statistics in other country:
Timeline:
This timeline shows a graph from 1996 to 2015 of Austria. No data until 1995. Number of actual observations by date: 20.
Source name:
World Development Indicators
Source organization:
International Labour Organization, Key Indicators of the Labour Market database.
Categories, topics:
Social Protection & Labor, Gender
Last updated:
apr 23, 2017
Indicators value changes by year
At the date of observation
Value
Absolute change
Change from previous value
jan 1, 1996
84.2
+84.2
0.0%
jan 1, 1997
86.4
+2.2
2.61%
jan 1, 1998
86.3
-0.1
-0.12%
jan 1, 1999
86.9
+0.6
0.7%
jan 1, 2000
87.2
+0.3
0.35%
jan 1, 2001
88.6
+1.4
1.61%
jan 1, 2002
87.8
-0.8
-0.9%
jan 1, 2003
88.1
+0.3
0.34%
jan 1, 2004
87.5
-0.6
-0.68%
jan 1, 2005
86.3
-1.2
-1.37%
jan 1, 2006
83.8
-2.5
-2.9%
jan 1, 2007
83.6
-0.2
-0.24%
jan 1, 2008
82.4
-1.2
-1.44%
jan 1, 2009
80.5
-1.9
-2.31%
jan 1, 2010
80.4
-0.1
-0.12%
jan 1, 2011
80.0
-0.4
-0.5%
jan 1, 2012
80.5
+0.5
0.63%
jan 1, 2013
80.6
+0.1
0.12%
jan 1, 2014
78.9
-1.7
-2.11%
jan 1, 2015
78.6
-0.3
-0.38%
Ranking of countries by current statistics by years


Comments: