29
/
en
AIzaSyAYiBZKx7MnpbEhh9jyipgxe19OcubqV5w
April 1, 2024
72229
Aruba
ABW
true
2
1
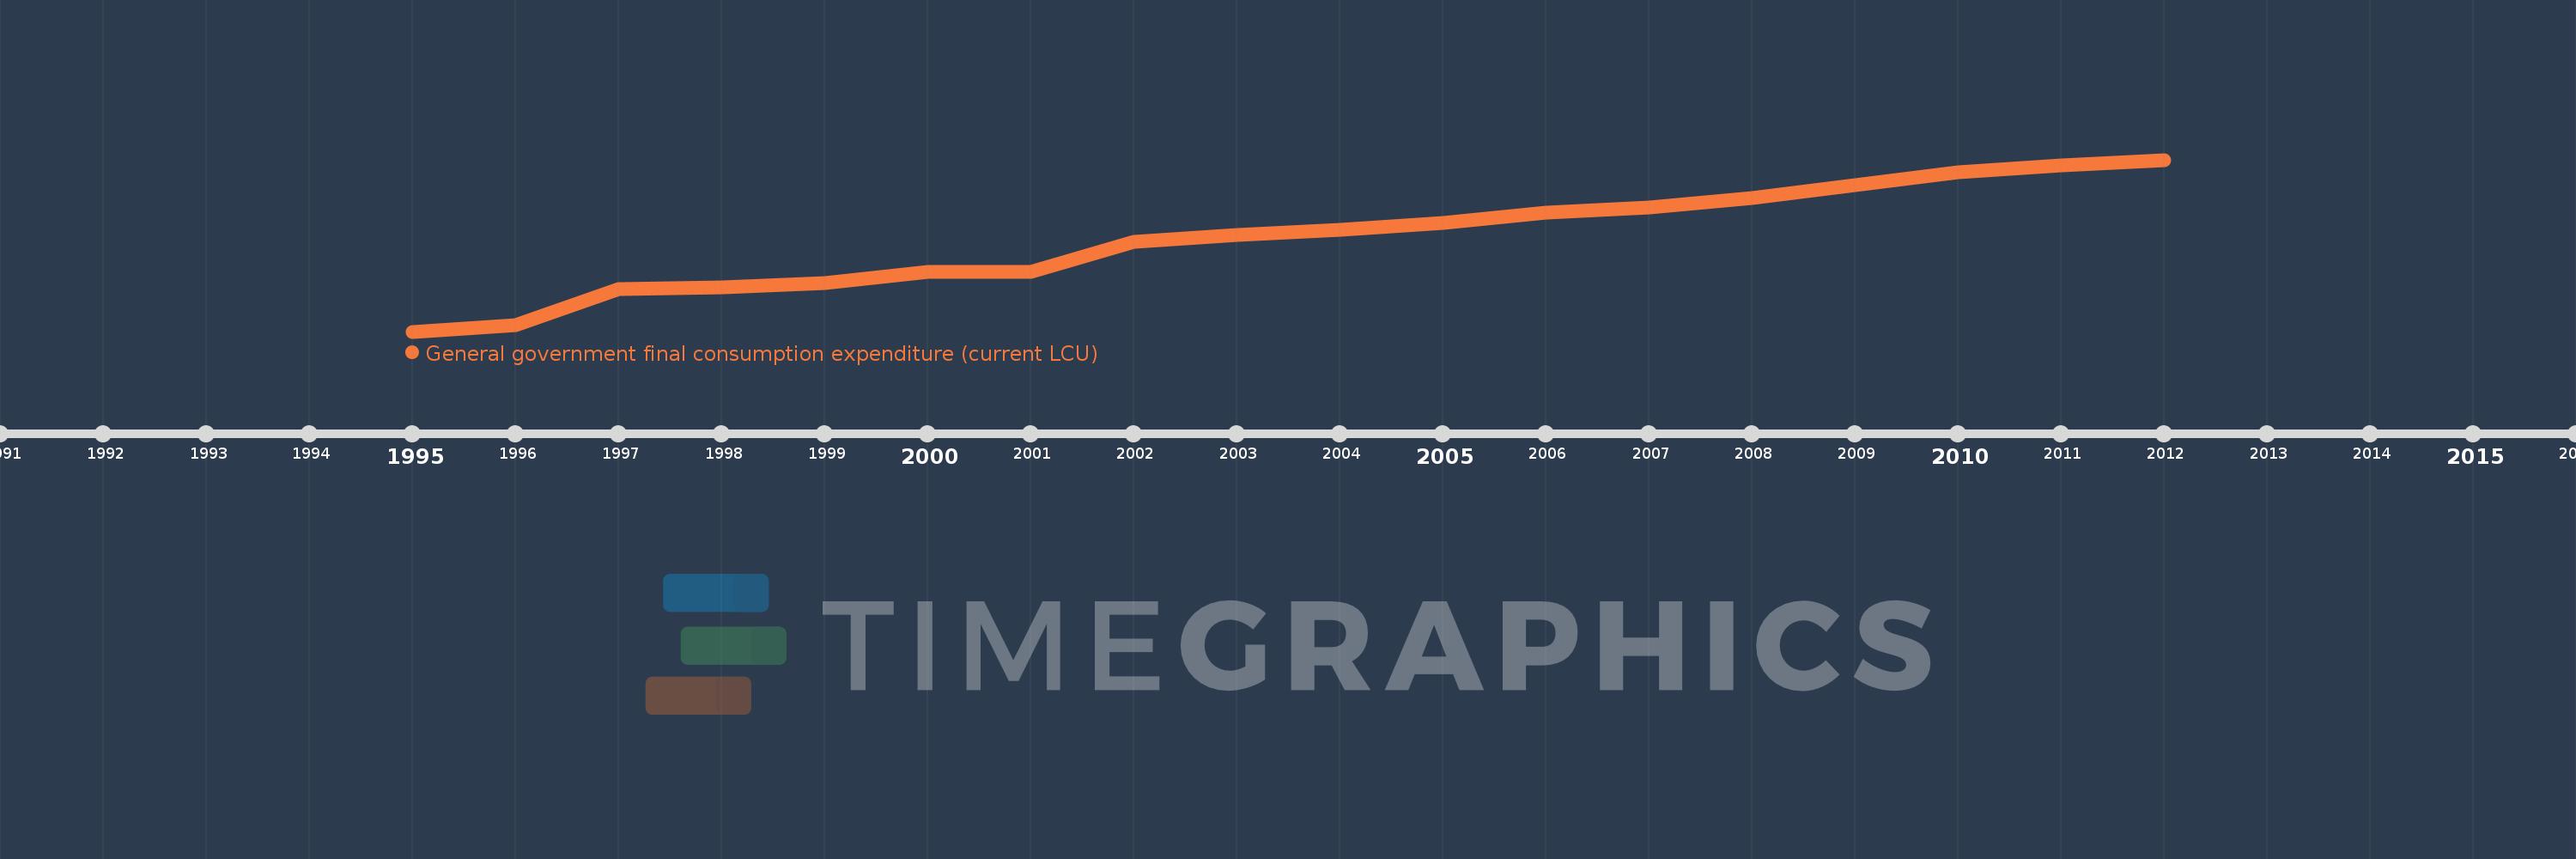
General government final consumption expenditure (current LCU)
2012,2011,2010,2009,2008,2007,2006,2005,2004,2003,2002,2001,2000,1999,1998,1997,1996,1995
This statistics in other country:
AfghanistanAlbaniaAlgeriaAngolaAntigua and BarbudaArgentinaArmeniaArubaAustraliaAustriaAzerbaijanBahamas, TheBahrainBangladeshBarbadosBelarusBelgiumBelizeBeninBermudaBhutanBoliviaBosnia and HerzegovinaBotswanaBrazilBrunei DarussalamBulgariaBurkina FasoBurundiCabo VerdeCambodiaCameroonCanadaCentral African RepublicChadChileChinaColombiaComorosCongo, Dem. Rep.Congo, Rep.Costa RicaCote d'IvoireCroatiaCubaCyprusCzech RepublicDenmarkDjiboutiDominicaDominican RepublicEcuadorEgypt, Arab Rep.El SalvadorEquatorial GuineaEritreaEstoniaEthiopiaFaroe IslandsFijiFinlandFranceFrench PolynesiaGabonGambia, TheGeorgiaGermanyGhanaGreeceGrenadaGuatemalaGuineaGuinea-BissauGuyanaHaitiHondurasHong Kong SAR, ChinaHungaryIcelandIndiaIndonesiaIran, Islamic Rep.IraqIrelandIsraelItalyJamaicaJapanJordanKazakhstanKenyaKiribatiKorea, Rep.KosovoKuwaitKyrgyz RepublicLao PDRLatviaLebanonLesothoLiberiaLibyaLithuaniaLuxembourgMacao SAR, ChinaMacedonia, FYRMadagascarMalawiMalaysiaMaldivesMaliMaltaMauritaniaMauritiusMexicoMicronesia, Fed. Sts.MoldovaMongoliaMontenegroMoroccoMozambiqueNamibiaNepalNetherlandsNew CaledoniaNew ZealandNicaraguaNigerNigeriaNorwayOmanPakistanPanamaPapua New GuineaParaguayPeruPhilippinesPolandPortugalPuerto RicoQatarRomaniaRussian FederationRwandaSaudi ArabiaSenegalSerbiaSeychellesSierra LeoneSingaporeSlovak RepublicSloveniaSolomon IslandsSomaliaSouth AfricaSouth SudanSpainSri LankaSt. Kitts and NevisSt. LuciaSt. Vincent and the GrenadinesSudanSurinameSwazilandSwedenSwitzerlandSyrian Arab RepublicTajikistanTanzaniaThailandTimor-LesteTogoTongaTrinidad and TobagoTunisiaTurkeyTurkmenistanUgandaUkraineUnited Arab EmiratesUnited KingdomUnited StatesUruguayUzbekistanVanuatuVenezuela, RBVietnamWest Bank and GazaYemen, Rep.ZambiaZimbabwe Timeline:
This timeline shows a graph from 1995 to 2012 of Aruba. No data until 1994. Number of actual observations by date: 18.
Source name:
World Development Indicators
Source organization:
World Bank national accounts data, and OECD National Accounts data files.
Categories, topics:
Economy & Growth
Last updated:
apr 23, 2017
Indicators value changes by year
Minimum:
472.0 mln
jan 1, 1995
Maximum:
1.186 bln
jan 1, 2012
At the date of observation
Value
Absolute change
Change from previous value
jan 1, 1995
472.0 mln
+472.0 mln
0.0%
jan 1, 1996
498.0 mln
+26.0 mln
5.51%
jan 1, 1997
647.0 mln
+149.0 mln
29.92%
jan 1, 1998
655.0 mln
+8.0 mln
1.24%
jan 1, 1999
673.96 mln
+18.96 mln
2.89%
jan 1, 2000
718.3 mln
+44.34 mln
6.58%
jan 1, 2001
718.3 mln
0.0
0.0%
jan 1, 2002
843.3 mln
+125.0 mln
17.4%
jan 1, 2003
874.07 mln
+30.77 mln
3.65%
jan 1, 2004
894.42 mln
+20.35 mln
2.33%
jan 1, 2005
923.74 mln
+29.32 mln
3.28%
jan 1, 2006
964.69 mln
+40.95 mln
4.43%
jan 1, 2007
986.88 mln
+22.19 mln
2.3%
jan 1, 2008
1.026 bln
+39.51 mln
4.0%
jan 1, 2009
1.081 bln
+54.94 mln
5.35%
jan 1, 2010
1.135 bln
+53.86 mln
4.98%
jan 1, 2011
1.162 bln
+27.14 mln
2.39%
jan 1, 2012
1.186 bln
+23.23 mln
2.0%
Ranking of countries by current statistics by years


Comments: