29
/
en
AIzaSyAYiBZKx7MnpbEhh9jyipgxe19OcubqV5w
April 1, 2024
71526
Armenia
ARM
true
2
1
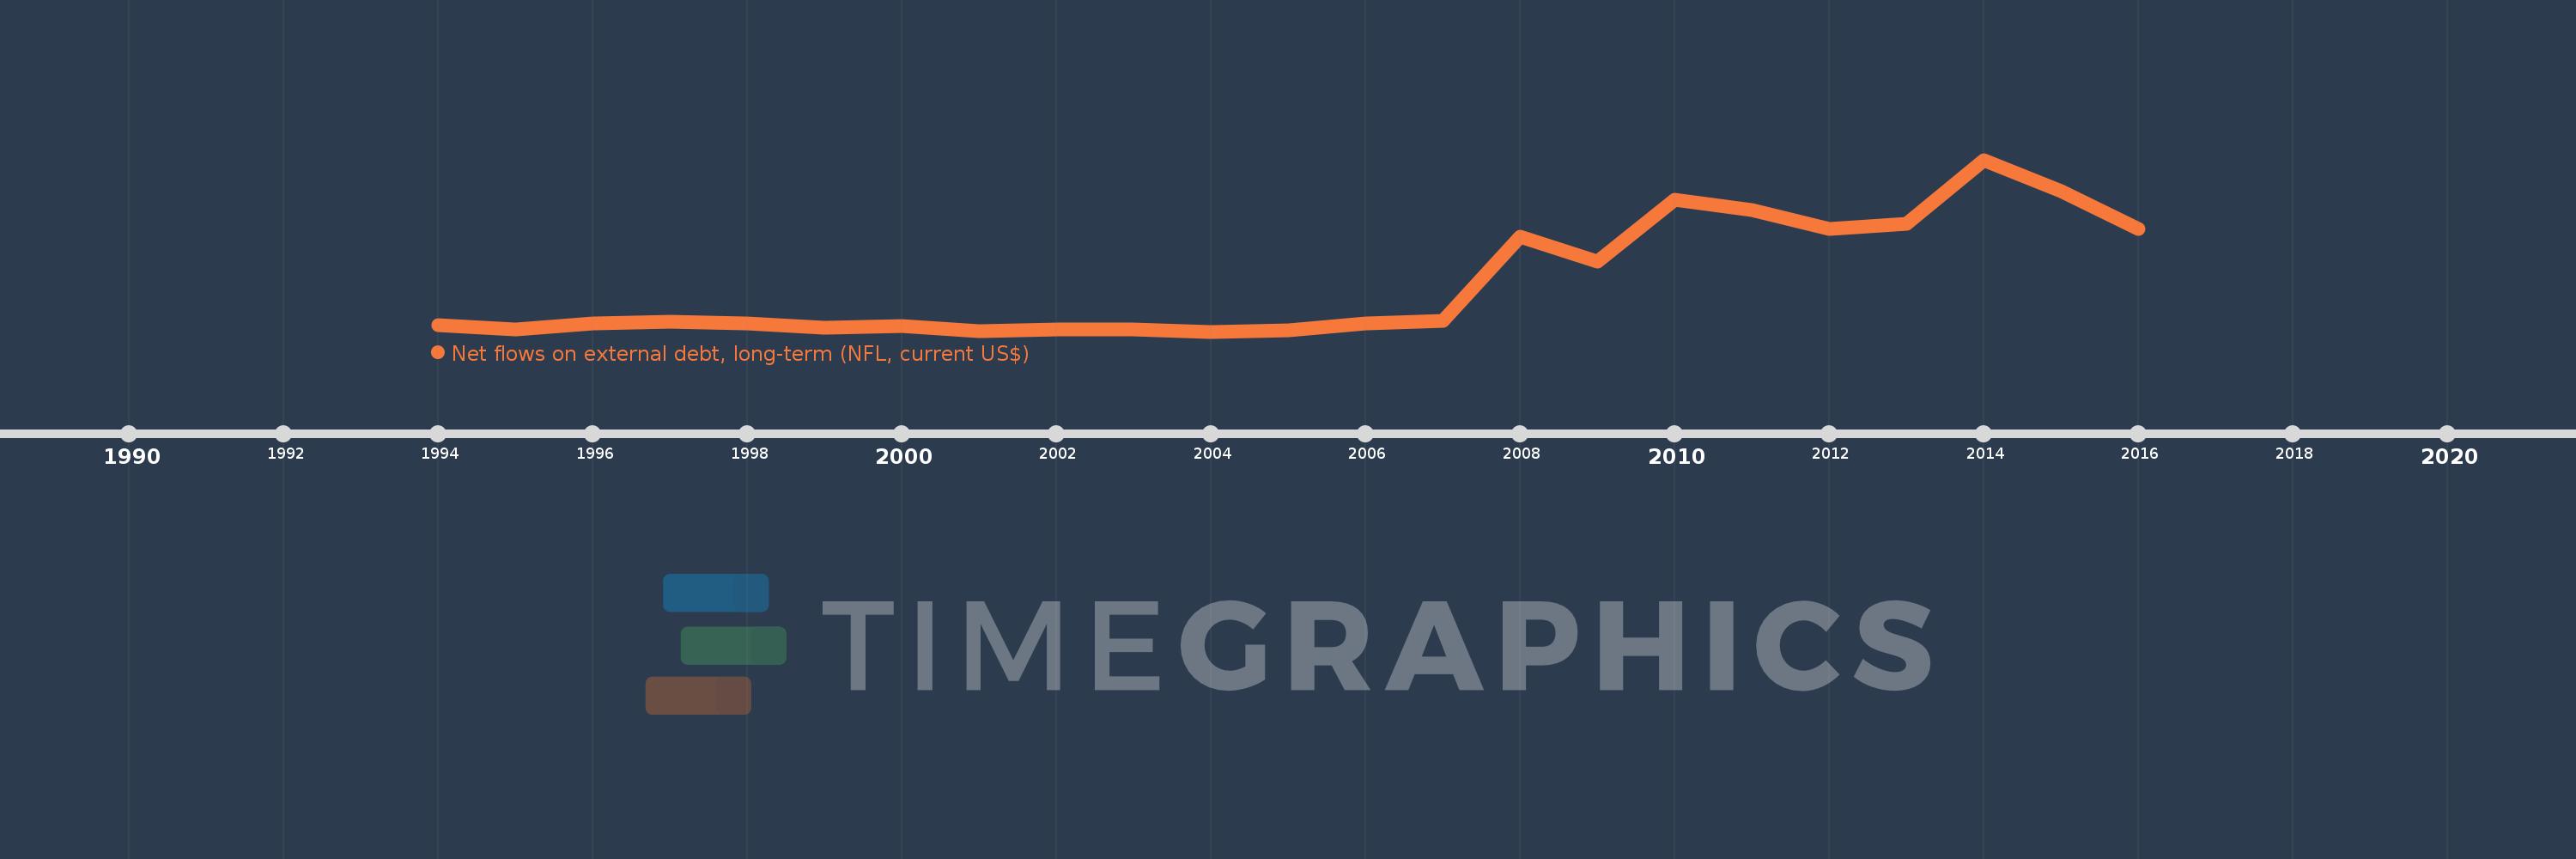
Net flows on external debt, long-term (NFL, current US$)
2016,2015,2014,2013,2012,2011,2010,2009,2008,2007,2006,2005,2004,2003,2002,2001,2000,1999,1998,1997,1996,1995,1994
This statistics in other country:
Timeline:
This timeline shows a graph from 1994 to 2016 of Armenia. No data until 1993. Number of actual observations by date: 23.
Source name:
World Development Indicators
Source organization:
World Bank, International Debt Statistics.
Categories, topics:
External Debt
Last updated:
apr 23, 2017
Indicators value changes by year
Minimum:
44.946 mln
jan 1, 2004
Maximum:
1.218 bln
jan 1, 2014
At the date of observation
Value
Absolute change
Change from previous value
jan 1, 1994
86.756 mln
+86.756 mln
0.0%
jan 1, 1995
60.541 mln
-26.215 mln
-30.22%
jan 1, 1996
99.549 mln
+39.008 mln
64.43%
jan 1, 1997
113.319 mln
+13.77 mln
13.83%
jan 1, 1998
100.48 mln
-12.839 mln
-11.33%
jan 1, 1999
72.118 mln
-28.362 mln
-28.23%
jan 1, 2000
83.23 mln
+11.112 mln
15.41%
jan 1, 2001
47.659 mln
-35.571 mln
-42.74%
jan 1, 2002
59.099 mln
+11.44 mln
24.0%
jan 1, 2003
57.5 mln
-1.599 mln
-2.71%
jan 1, 2004
44.946 mln
-12.554 mln
-21.83%
jan 1, 2005
56.448 mln
+11.502 mln
25.59%
jan 1, 2006
98.443 mln
+41.995 mln
74.4%
jan 1, 2007
116.464 mln
+18.021 mln
18.31%
jan 1, 2008
692.643 mln
+576.179 mln
494.73%
jan 1, 2009
523.021 mln
-169.622 mln
-24.49%
jan 1, 2010
947.457 mln
+424.436 mln
81.15%
jan 1, 2011
877.298 mln
-70.159 mln
-7.4%
jan 1, 2012
748.089 mln
-129.209 mln
-14.73%
jan 1, 2013
779.038 mln
+30.949 mln
4.14%
jan 1, 2014
1.218 bln
+438.703 mln
56.31%
jan 1, 2015
1.002 bln
-215.668 mln
-17.71%
jan 1, 2016
746.724 mln
-255.349 mln
-25.48%
Ranking of countries by current statistics by years


Comments: