29
/
en
AIzaSyAYiBZKx7MnpbEhh9jyipgxe19OcubqV5w
April 1, 2024
71368
Armenia
ARM
true
2
1
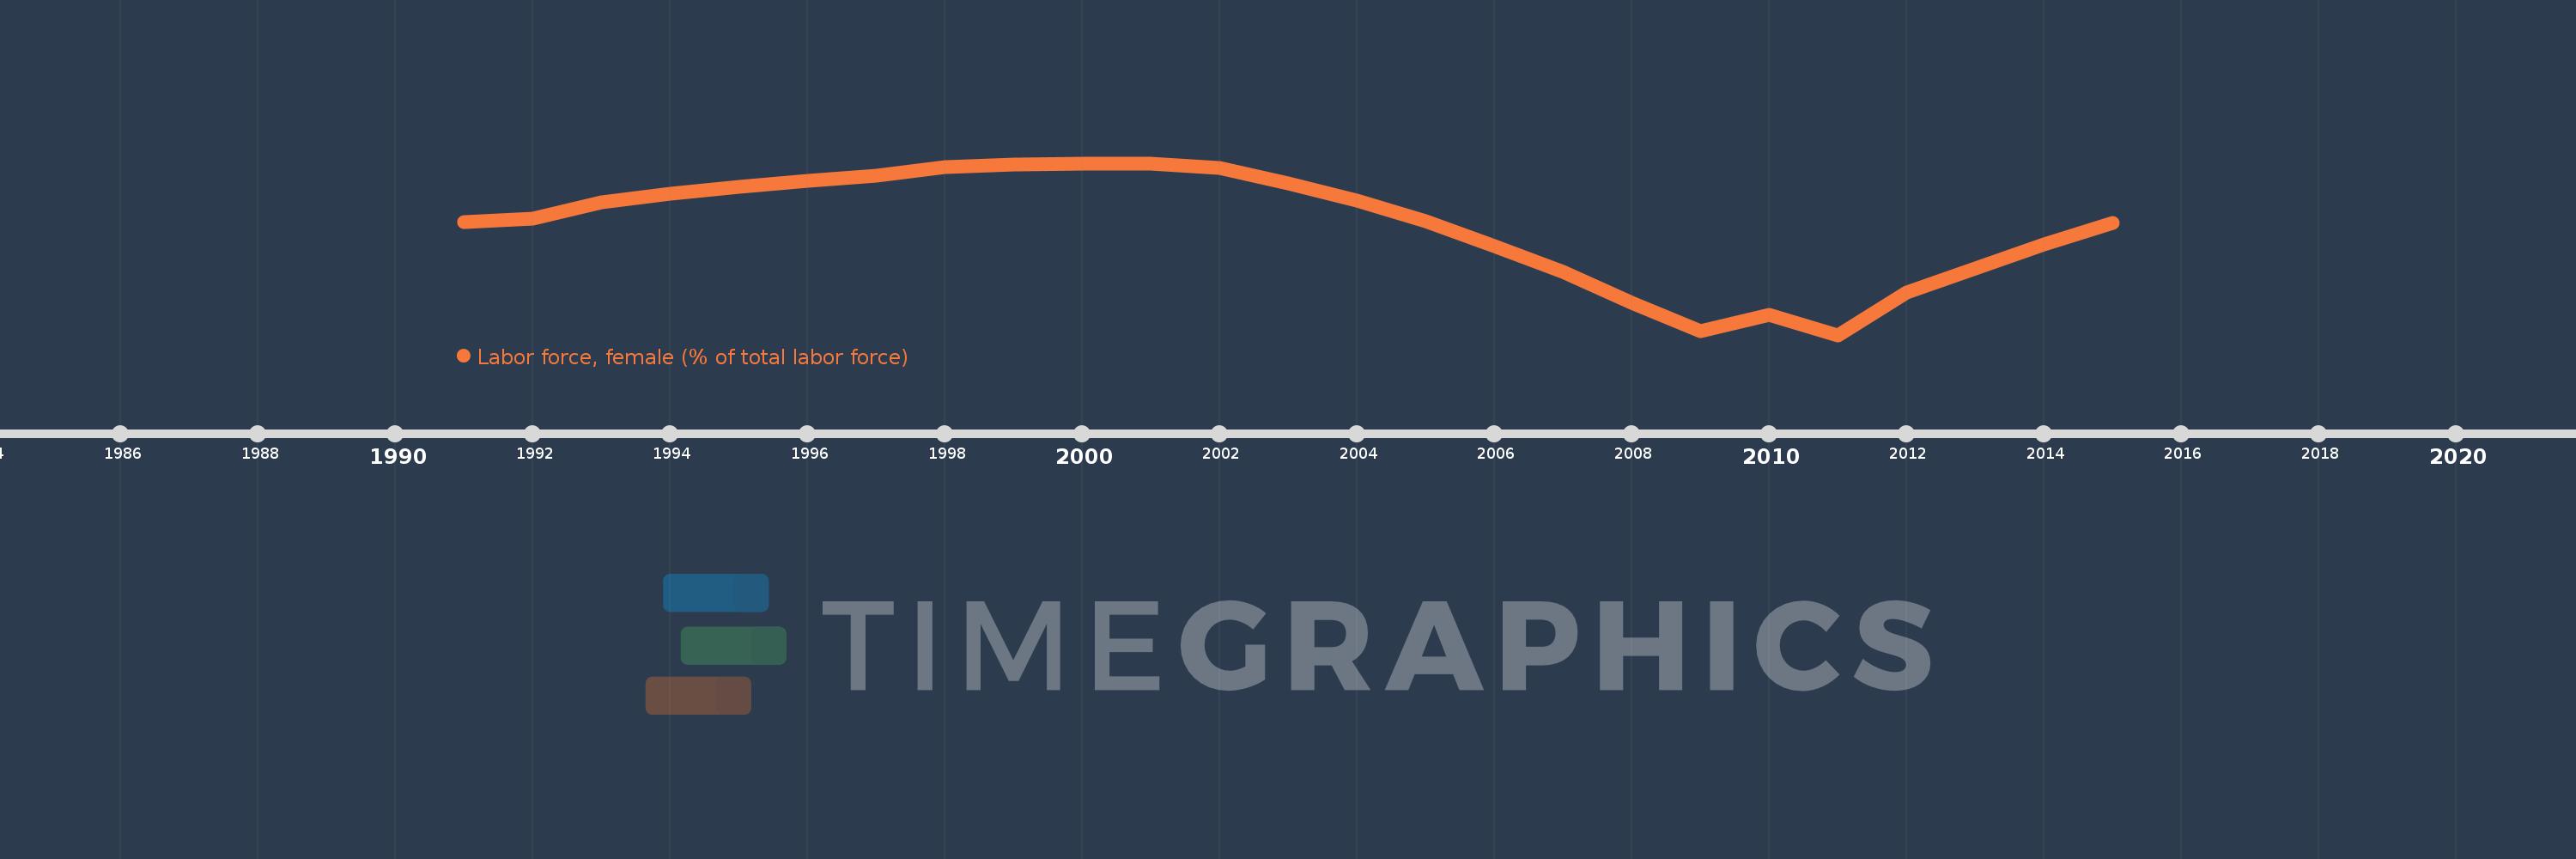
Labor force, female (% of total labor force)
2015,2014,2013,2012,2011,2010,2009,2008,2007,2006,2005,2004,2003,2002,2001,2000,1999,1998,1997,1996,1995,1994,1993,1992,1991
This statistics in other country:
AfghanistanAlbaniaAlgeriaAngolaArab WorldArgentinaArmeniaAustraliaAustriaAzerbaijanBahamas, TheBahrainBangladeshBarbadosBelarusBelgiumBelizeBeninBhutanBoliviaBosnia and HerzegovinaBotswanaBrazilBrunei DarussalamBulgariaBurkina FasoBurundiCabo VerdeCambodiaCameroonCanadaCaribbean small statesCentral African RepublicCentral Europe and the BalticsChadChannel IslandsChileChinaColombiaComorosCongo, Dem. Rep.Congo, Rep.Costa RicaCote d'IvoireCroatiaCubaCyprusCzech RepublicDenmarkDjiboutiDominican RepublicEarly-demographic dividendEast Asia & PacificEast Asia & Pacific (excluding high income)East Asia & Pacific (IDA & IBRD countries)EcuadorEgypt, Arab Rep.El SalvadorEquatorial GuineaEritreaEstoniaEthiopiaEuro areaEurope & Central AsiaEurope & Central Asia (excluding high income)Europe & Central Asia (IDA & IBRD countries)European UnionFijiFinlandFragile and conflict affected situationsFranceFrench PolynesiaGabonGambia, TheGeorgiaGermanyGhanaGreeceGuamGuatemalaGuineaGuinea-BissauGuyanaHaitiHeavily indebted poor countries (HIPC)High incomeHondurasHong Kong SAR, ChinaHungaryIBRD onlyIcelandIDA & IBRD totalIDA blendIDA onlyIDA totalIndiaIndonesiaIran, Islamic Rep.IraqIrelandIsraelItalyJamaicaJapanJordanKazakhstanKenyaKorea, Dem. People’s Rep.Korea, Rep.KuwaitKyrgyz RepublicLao PDRLate-demographic dividendLatin America & Caribbean Latin America & Caribbean (excluding high income)Latin America & the Caribbean (IDA & IBRD countries)LatviaLeast developed countries: UN classificationLebanonLesothoLiberiaLibyaLithuaniaLow & middle incomeLow incomeLower middle incomeLuxembourgMacao SAR, ChinaMacedonia, FYRMadagascarMalawiMalaysiaMaldivesMaliMaltaMauritaniaMauritiusMexicoMiddle East & North AfricaMiddle East & North Africa (excluding high income)Middle East & North Africa (IDA & IBRD countries)Middle incomeMoldovaMongoliaMontenegroMoroccoMozambiqueMyanmarNamibiaNepalNetherlandsNew CaledoniaNew ZealandNicaraguaNigerNigeriaNorth AmericaNorwayOECD membersOmanOther small statesPacific island small statesPakistanPanamaPapua New GuineaParaguayPeruPhilippinesPolandPortugalPost-demographic dividendPre-demographic dividendPuerto RicoQatarRomaniaRussian FederationRwandaSamoaSao Tome and PrincipeSaudi ArabiaSenegalSerbiaSierra LeoneSingaporeSlovak RepublicSloveniaSmall statesSolomon IslandsSomaliaSouth AfricaSouth AsiaSouth Asia (IDA & IBRD)SpainSri LankaSt. LuciaSt. Vincent and the GrenadinesSub-Saharan Africa Sub-Saharan Africa (excluding high income)Sub-Saharan Africa (IDA & IBRD countries)SudanSurinameSwazilandSwedenSwitzerlandSyrian Arab RepublicTajikistanTanzaniaThailandTimor-LesteTogoTongaTrinidad and TobagoTunisiaTurkeyTurkmenistanUgandaUkraineUnited Arab EmiratesUnited KingdomUnited StatesUpper middle incomeUruguayUzbekistanVanuatuVenezuela, RBVietnamVirgin Islands (U.S.)West Bank and GazaWorldYemen, Rep.ZambiaZimbabwe Timeline:
This timeline shows a graph from 1991 to 2015 of Armenia. No data until 1990. Number of actual observations by date: 25.
Source name:
World Development Indicators
Source organization:
International Labour Organization, using World Bank population estimates.
Categories, topics:
Education, Social Protection & Labor, Gender
Last updated:
apr 23, 2017
Indicators value changes by year
Minimum:
41.374
jan 1, 2011
Maximum:
48.764
jan 1, 2001
At the date of observation
Value
Absolute change
Change from previous value
jan 1, 1991
46.219
+46.219
0.0%
jan 1, 1992
46.374
+0.154
0.33%
jan 1, 1993
47.074
+0.701
1.51%
jan 1, 1994
47.467
+0.393
0.83%
jan 1, 1995
47.744
+0.277
0.58%
jan 1, 1996
48.019
+0.275
0.58%
jan 1, 1997
48.238
+0.219
0.46%
jan 1, 1998
48.58
+0.342
0.71%
jan 1, 1999
48.705
+0.124
0.26%
jan 1, 2000
48.749
+0.044
0.09%
jan 1, 2001
48.764
+0.015
0.03%
jan 1, 2002
48.543
-0.221
-0.45%
jan 1, 2003
47.893
-0.65
-1.34%
jan 1, 2004
47.158
-0.734
-1.53%
jan 1, 2005
46.253
-0.906
-1.92%
jan 1, 2006
45.207
-1.046
-2.26%
jan 1, 2007
44.094
-1.113
-2.46%
jan 1, 2008
42.763
-1.331
-3.02%
jan 1, 2009
41.524
-1.24
-2.9%
jan 1, 2010
42.247
+0.724
1.74%
jan 1, 2011
41.374
-0.873
-2.07%
jan 1, 2012
43.188
+1.814
4.38%
jan 1, 2013
44.233
+1.045
2.42%
jan 1, 2014
45.262
+1.029
2.33%
jan 1, 2015
46.178
+0.916
2.02%
Ranking of countries by current statistics by years


Comments: