29
/
en
AIzaSyAYiBZKx7MnpbEhh9jyipgxe19OcubqV5w
April 1, 2024
67452
Angola
AGO
true
2
1
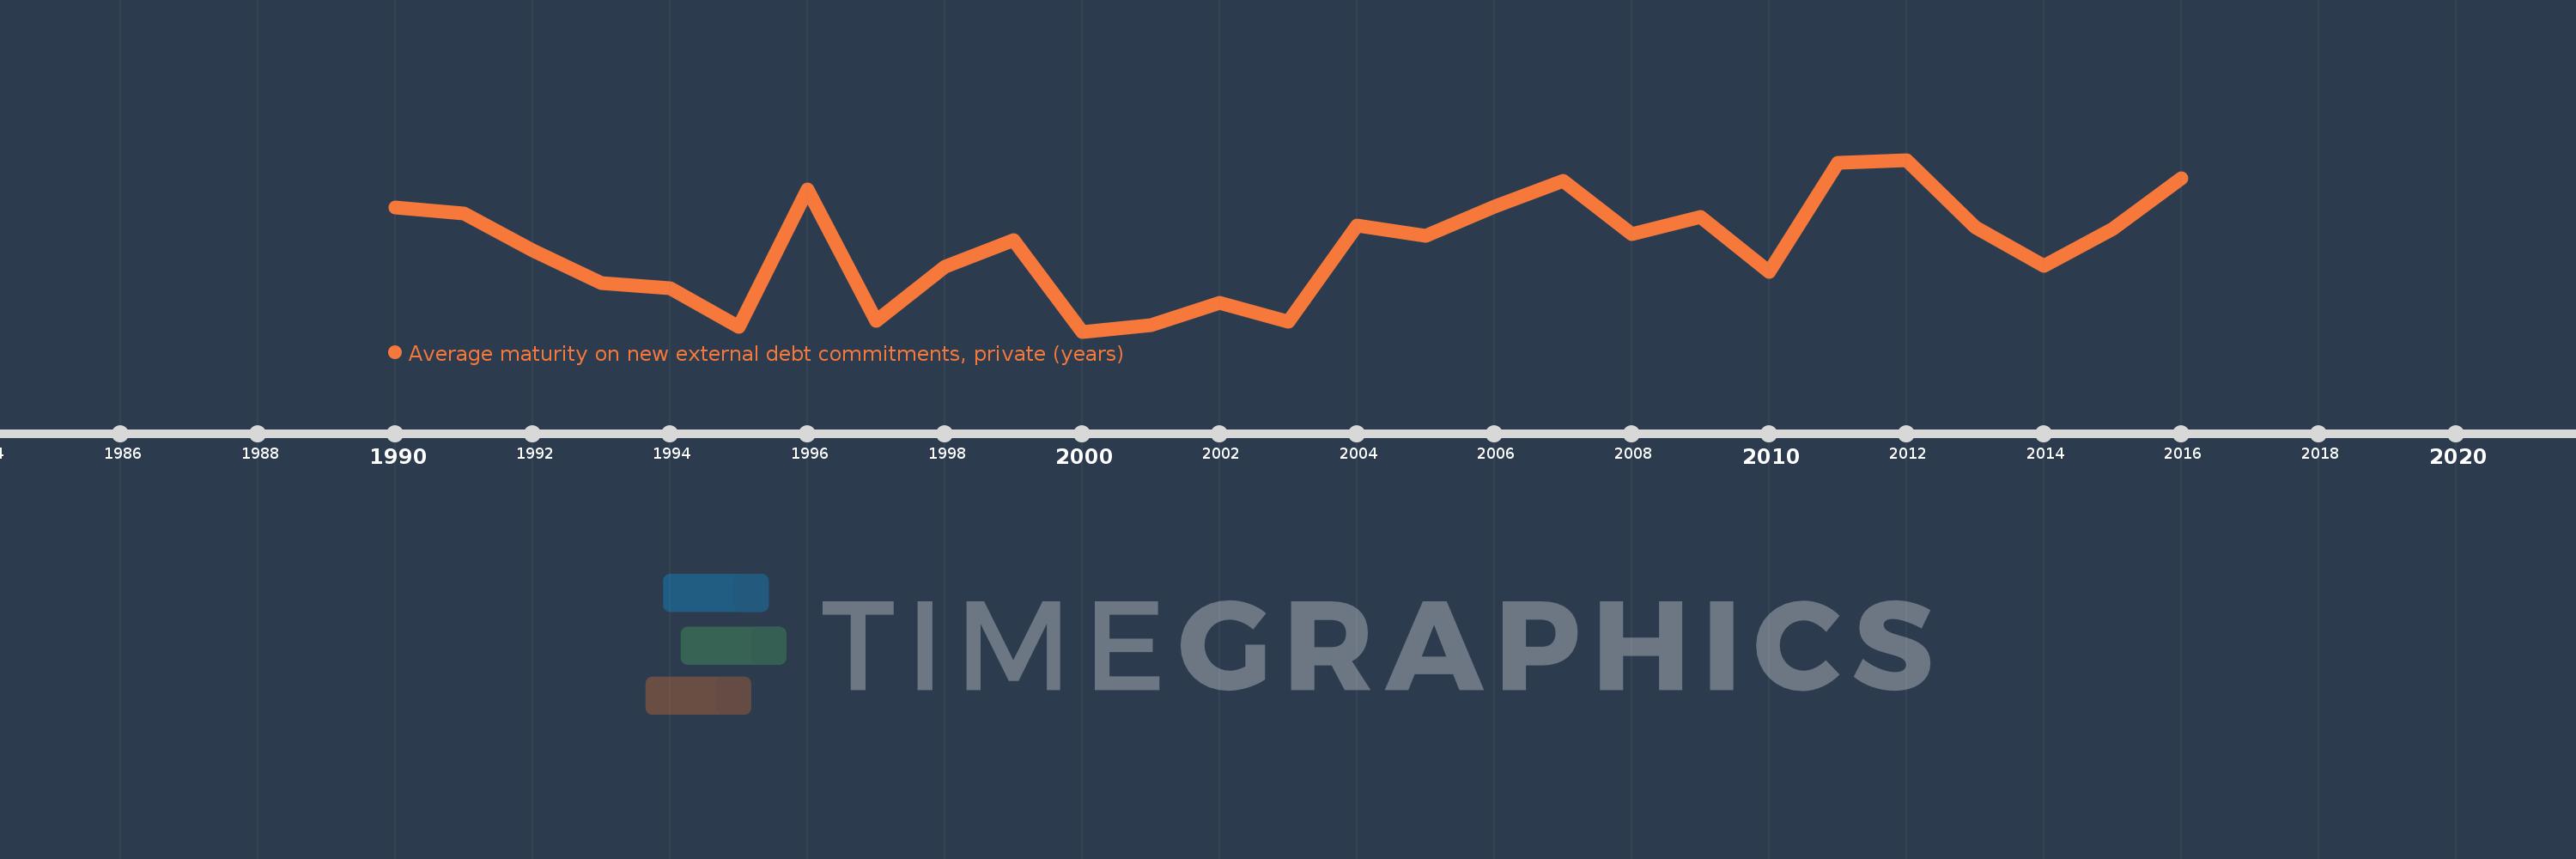
Average maturity on new external debt commitments, private (years)
2016,2015,2014,2013,2012,2011,2010,2009,2008,2007,2006,2005,2004,2003,2002,2001,2000,1999,1998,1997,1996,1995,1994,1993,1992,1991,1990
This statistics in other country:
Timeline:
This timeline shows a graph from 1990 to 2016 of Angola. No data until 1989. Number of actual observations by date: 27.
Source name:
World Development Indicators
Source organization:
World Bank, International Debt Statistics.
Categories, topics:
External Debt
Last updated:
apr 23, 2017
Indicators value changes by year
At the date of observation
Value
Absolute change
Change from previous value
jan 1, 1990
7.902
+7.902
0.0%
jan 1, 1991
7.654
-0.248
-3.14%
jan 1, 1992
6.157
-1.497
-19.56%
jan 1, 1993
4.812
-1.345
-21.85%
jan 1, 1994
4.603
-0.209
-4.35%
jan 1, 1995
3.012
-1.59
-34.56%
jan 1, 1996
8.646
+5.634
187.05%
jan 1, 1997
3.273
-5.374
-62.15%
jan 1, 1998
5.475
+2.202
67.29%
jan 1, 1999
6.579
+1.104
20.16%
jan 1, 2000
2.827
-3.752
-57.03%
jan 1, 2001
3.083
+0.256
9.07%
jan 1, 2002
4.011
+0.928
30.09%
jan 1, 2003
3.239
-0.772
-19.25%
jan 1, 2004
7.179
+3.94
121.64%
jan 1, 2005
6.76
-0.419
-5.84%
jan 1, 2006
7.962
+1.202
17.77%
jan 1, 2007
9.017
+1.055
13.26%
jan 1, 2008
6.806
-2.211
-24.52%
jan 1, 2009
7.524
+0.718
10.55%
jan 1, 2010
5.284
-2.24
-29.77%
jan 1, 2011
9.743
+4.459
84.39%
jan 1, 2012
9.867
+0.124
1.27%
jan 1, 2013
7.119
-2.748
-27.85%
jan 1, 2014
5.536
-1.583
-22.24%
jan 1, 2015
7.019
+1.483
26.78%
jan 1, 2016
9.119
+2.1
29.93%
Ranking of countries by current statistics by years


Comments: