29
/
en
AIzaSyAYiBZKx7MnpbEhh9jyipgxe19OcubqV5w
April 1, 2024
65226
Albania
ALB
true
2
1
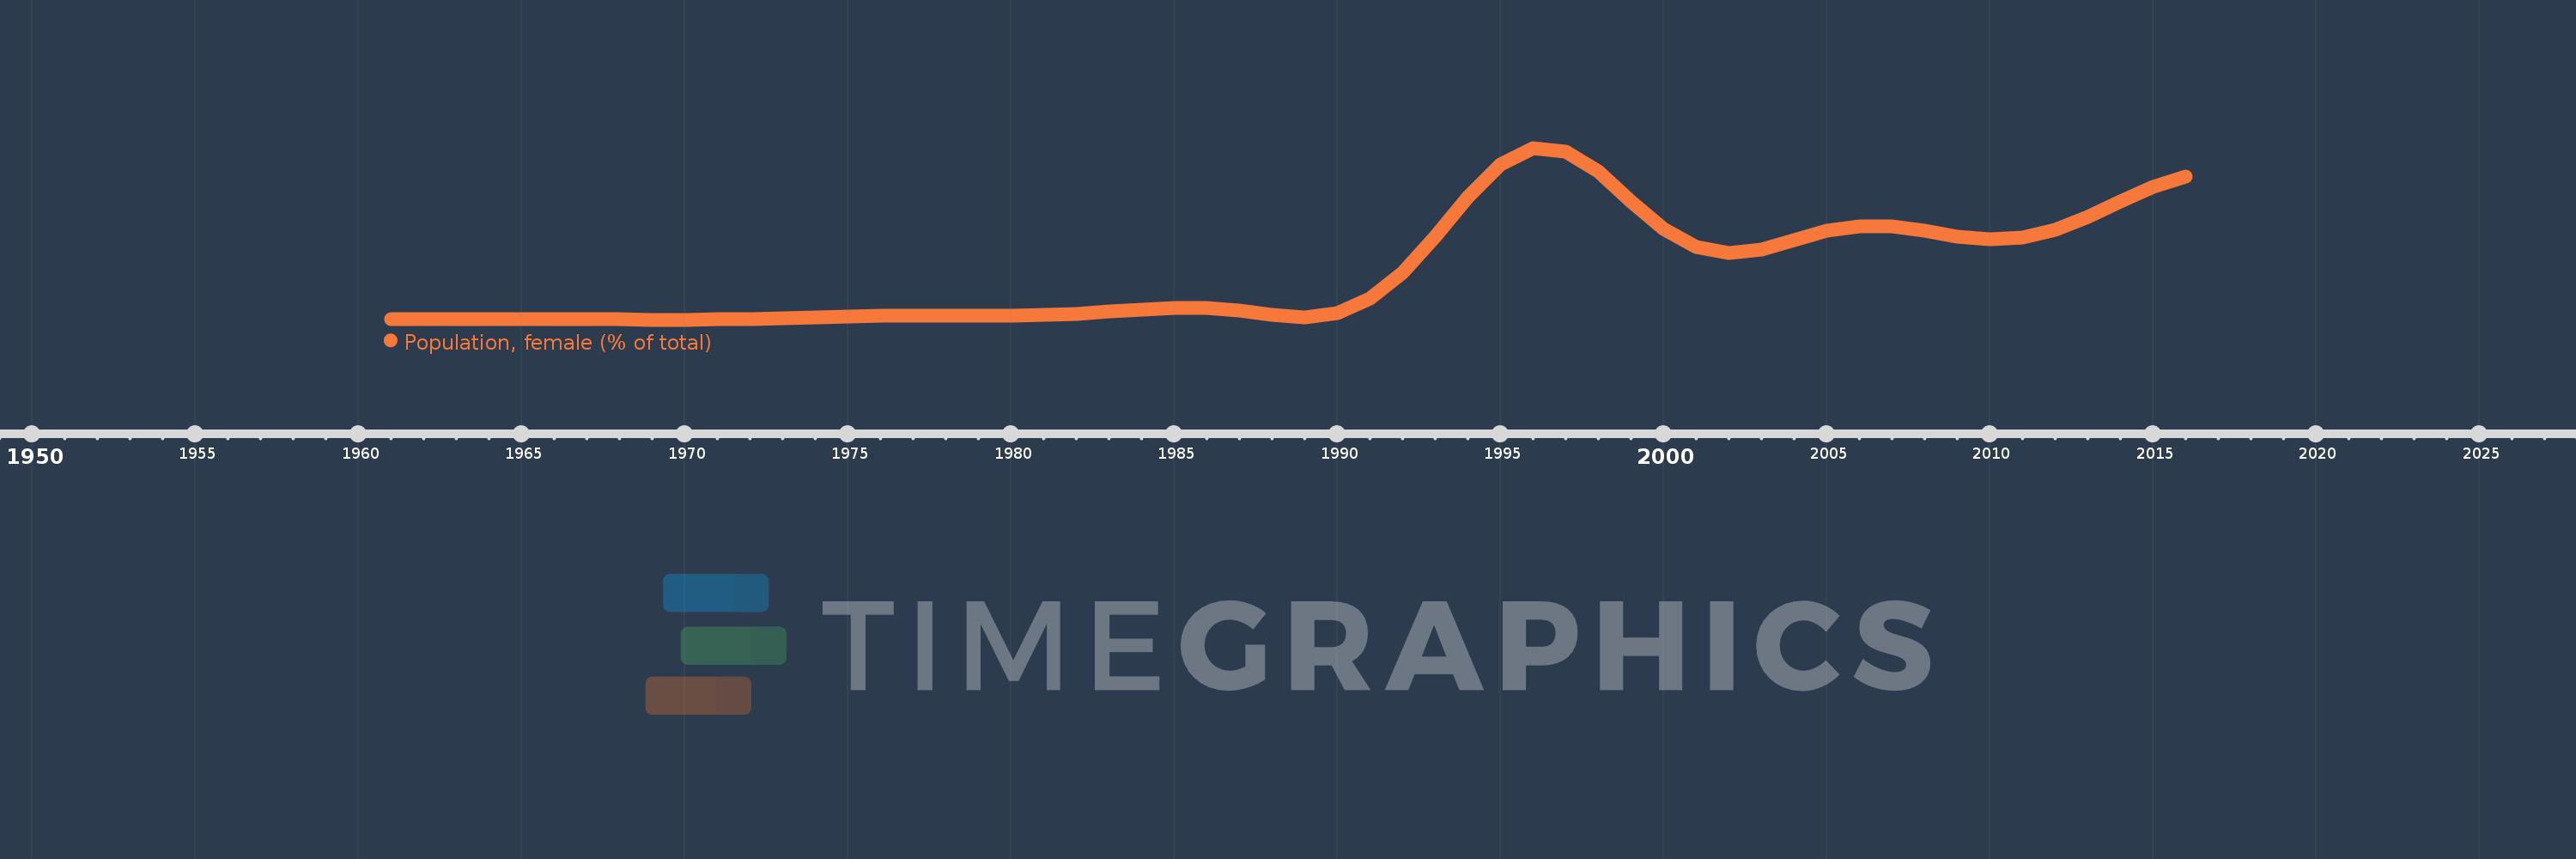
Population, female (% of total)
2016,2015,2014,2013,2012,2011,2010,2009,2008,2007,2006,2005,2004,2003,2002,2001,2000,1999,1998,1997,1996,1995,1994,1993,1992,1991,1990,1989,1988,1987,1986,1985,1984,1983,1982,1981,1980,1979,1978,1977,1976,1975,1974,1973,1972,1971,1970,1969,1968,1967,1966,1965,1964,1963,1962,1961
This statistics in other country:
AfghanistanAlbaniaAlgeriaAngolaAntigua and BarbudaArab WorldArgentinaArmeniaArubaAustraliaAustriaAzerbaijanBahamas, TheBahrainBangladeshBarbadosBelarusBelgiumBelizeBeninBhutanBoliviaBosnia and HerzegovinaBotswanaBrazilBrunei DarussalamBulgariaBurkina FasoBurundiCabo VerdeCambodiaCameroonCanadaCaribbean small statesCentral African RepublicCentral Europe and the BalticsChadChannel IslandsChileChinaColombiaComorosCongo, Dem. Rep.Congo, Rep.Costa RicaCote d'IvoireCroatiaCubaCuracaoCyprusCzech RepublicDenmarkDjiboutiDominican RepublicEarly-demographic dividendEast Asia & PacificEast Asia & Pacific (excluding high income)East Asia & Pacific (IDA & IBRD countries)EcuadorEgypt, Arab Rep.El SalvadorEquatorial GuineaEritreaEstoniaEthiopiaEuro areaEurope & Central AsiaEurope & Central Asia (excluding high income)Europe & Central Asia (IDA & IBRD countries)European UnionFijiFinlandFragile and conflict affected situationsFranceFrench PolynesiaGabonGambia, TheGeorgiaGermanyGhanaGreeceGrenadaGuamGuatemalaGuineaGuinea-BissauGuyanaHaitiHeavily indebted poor countries (HIPC)High incomeHondurasHong Kong SAR, ChinaHungaryIBRD onlyIcelandIDA & IBRD totalIDA blendIDA onlyIDA totalIndiaIndonesiaIran, Islamic Rep.IraqIrelandIsraelItalyJamaicaJapanJordanKazakhstanKenyaKiribatiKorea, Dem. People’s Rep.Korea, Rep.KosovoKuwaitKyrgyz RepublicLao PDRLate-demographic dividendLatin America & Caribbean Latin America & Caribbean (excluding high income)Latin America & the Caribbean (IDA & IBRD countries)LatviaLeast developed countries: UN classificationLebanonLesothoLiberiaLibyaLithuaniaLow & middle incomeLow incomeLower middle incomeLuxembourgMacao SAR, ChinaMacedonia, FYRMadagascarMalawiMalaysiaMaldivesMaliMaltaMauritaniaMauritiusMexicoMicronesia, Fed. Sts.Middle East & North AfricaMiddle East & North Africa (excluding high income)Middle East & North Africa (IDA & IBRD countries)Middle incomeMoldovaMongoliaMontenegroMoroccoMozambiqueMyanmarNamibiaNepalNetherlandsNew CaledoniaNew ZealandNicaraguaNigerNigeriaNorth AmericaNorwayOECD membersOmanOther small statesPacific island small statesPakistanPanamaPapua New GuineaParaguayPeruPhilippinesPolandPortugalPost-demographic dividendPre-demographic dividendPuerto RicoQatarRomaniaRussian FederationRwandaSamoaSao Tome and PrincipeSaudi ArabiaSenegalSerbiaSeychellesSierra LeoneSingaporeSlovak RepublicSloveniaSmall statesSolomon IslandsSomaliaSouth AfricaSouth AsiaSouth Asia (IDA & IBRD)South SudanSpainSri LankaSt. LuciaSt. Vincent and the GrenadinesSub-Saharan Africa Sub-Saharan Africa (excluding high income)Sub-Saharan Africa (IDA & IBRD countries)SudanSurinameSwazilandSwedenSwitzerlandSyrian Arab RepublicTajikistanTanzaniaThailandTimor-LesteTogoTongaTrinidad and TobagoTunisiaTurkeyTurkmenistanUgandaUkraineUnited Arab EmiratesUnited KingdomUnited StatesUpper middle incomeUruguayUzbekistanVanuatuVenezuela, RBVietnamVirgin Islands (U.S.)West Bank and GazaWorldYemen, Rep.ZambiaZimbabwe Timeline:
This timeline shows a graph from 1961 to 2016 of Albania. No data until 1960. Number of actual observations by date: 56.
Source name:
World Development Indicators
Source organization:
World Bank staff estimates based on male/female distributions of United Nations Population Division's World Population Prospects.
Categories, topics:
Health
Last updated:
apr 23, 2017
Indicators value changes by year
Minimum:
48.509
jan 1, 1970
Maximum:
50.776
jan 1, 1996
At the date of observation
Value
Absolute change
Change from previous value
jan 1, 1961
48.52
+48.52
0.0%
jan 1, 1962
48.518
-0.002
0.0%
jan 1, 1963
48.519
+0.001
0.0%
jan 1, 1964
48.521
+0.002
0.0%
jan 1, 1965
48.522
+0.001
0.0%
jan 1, 1966
48.522
0.0
0.0%
jan 1, 1967
48.519
-0.003
-0.01%
jan 1, 1968
48.515
-0.004
-0.01%
jan 1, 1969
48.511
-0.004
-0.01%
jan 1, 1970
48.509
-0.001
0.0%
jan 1, 1971
48.512
+0.002
0.01%
jan 1, 1972
48.519
+0.007
0.01%
jan 1, 1973
48.529
+0.011
0.02%
jan 1, 1974
48.541
+0.012
0.02%
jan 1, 1975
48.551
+0.01
0.02%
jan 1, 1976
48.558
+0.007
0.01%
jan 1, 1977
48.561
+0.003
0.01%
jan 1, 1978
48.561
+0.0
0.0%
jan 1, 1979
48.561
0.0
0.0%
jan 1, 1980
48.563
+0.002
0.0%
jan 1, 1981
48.57
+0.007
0.01%
jan 1, 1982
48.588
+0.018
0.04%
jan 1, 1983
48.616
+0.028
0.06%
jan 1, 1984
48.645
+0.029
0.06%
jan 1, 1985
48.661
+0.017
0.03%
jan 1, 1986
48.661
0.0
0.0%
jan 1, 1987
48.627
-0.034
-0.07%
jan 1, 1988
48.571
-0.056
-0.12%
jan 1, 1989
48.541
-0.029
-0.06%
jan 1, 1990
48.6
+0.059
0.12%
jan 1, 1991
48.784
+0.183
0.38%
jan 1, 1992
49.125
+0.341
0.7%
jan 1, 1993
49.602
+0.477
0.97%
jan 1, 1994
50.126
+0.525
1.06%
jan 1, 1995
50.556
+0.429
0.86%
jan 1, 1996
50.776
+0.221
0.44%
jan 1, 1997
50.731
-0.045
-0.09%
jan 1, 1998
50.462
-0.269
-0.53%
jan 1, 1999
50.071
-0.391
-0.78%
jan 1, 2000
49.705
-0.366
-0.73%
jan 1, 2001
49.467
-0.238
-0.48%
jan 1, 2002
49.388
-0.079
-0.16%
jan 1, 2003
49.435
+0.046
0.09%
jan 1, 2004
49.557
+0.123
0.25%
jan 1, 2005
49.679
+0.122
0.25%
jan 1, 2006
49.746
+0.067
0.13%
jan 1, 2007
49.74
-0.006
-0.01%
jan 1, 2008
49.684
-0.056
-0.11%
jan 1, 2009
49.61
-0.074
-0.15%
jan 1, 2010
49.567
-0.043
-0.09%
jan 1, 2011
49.593
+0.025
0.05%
jan 1, 2012
49.7
+0.107
0.22%
jan 1, 2013
49.871
+0.171
0.34%
jan 1, 2014
50.073
+0.202
0.41%
jan 1, 2015
50.26
+0.186
0.37%
jan 1, 2016
50.398
+0.138
0.27%
Ranking of countries by current statistics by years


Comments: