29
/
en
AIzaSyAYiBZKx7MnpbEhh9jyipgxe19OcubqV5w
April 1, 2024
64791
Albania
ALB
true
2
1
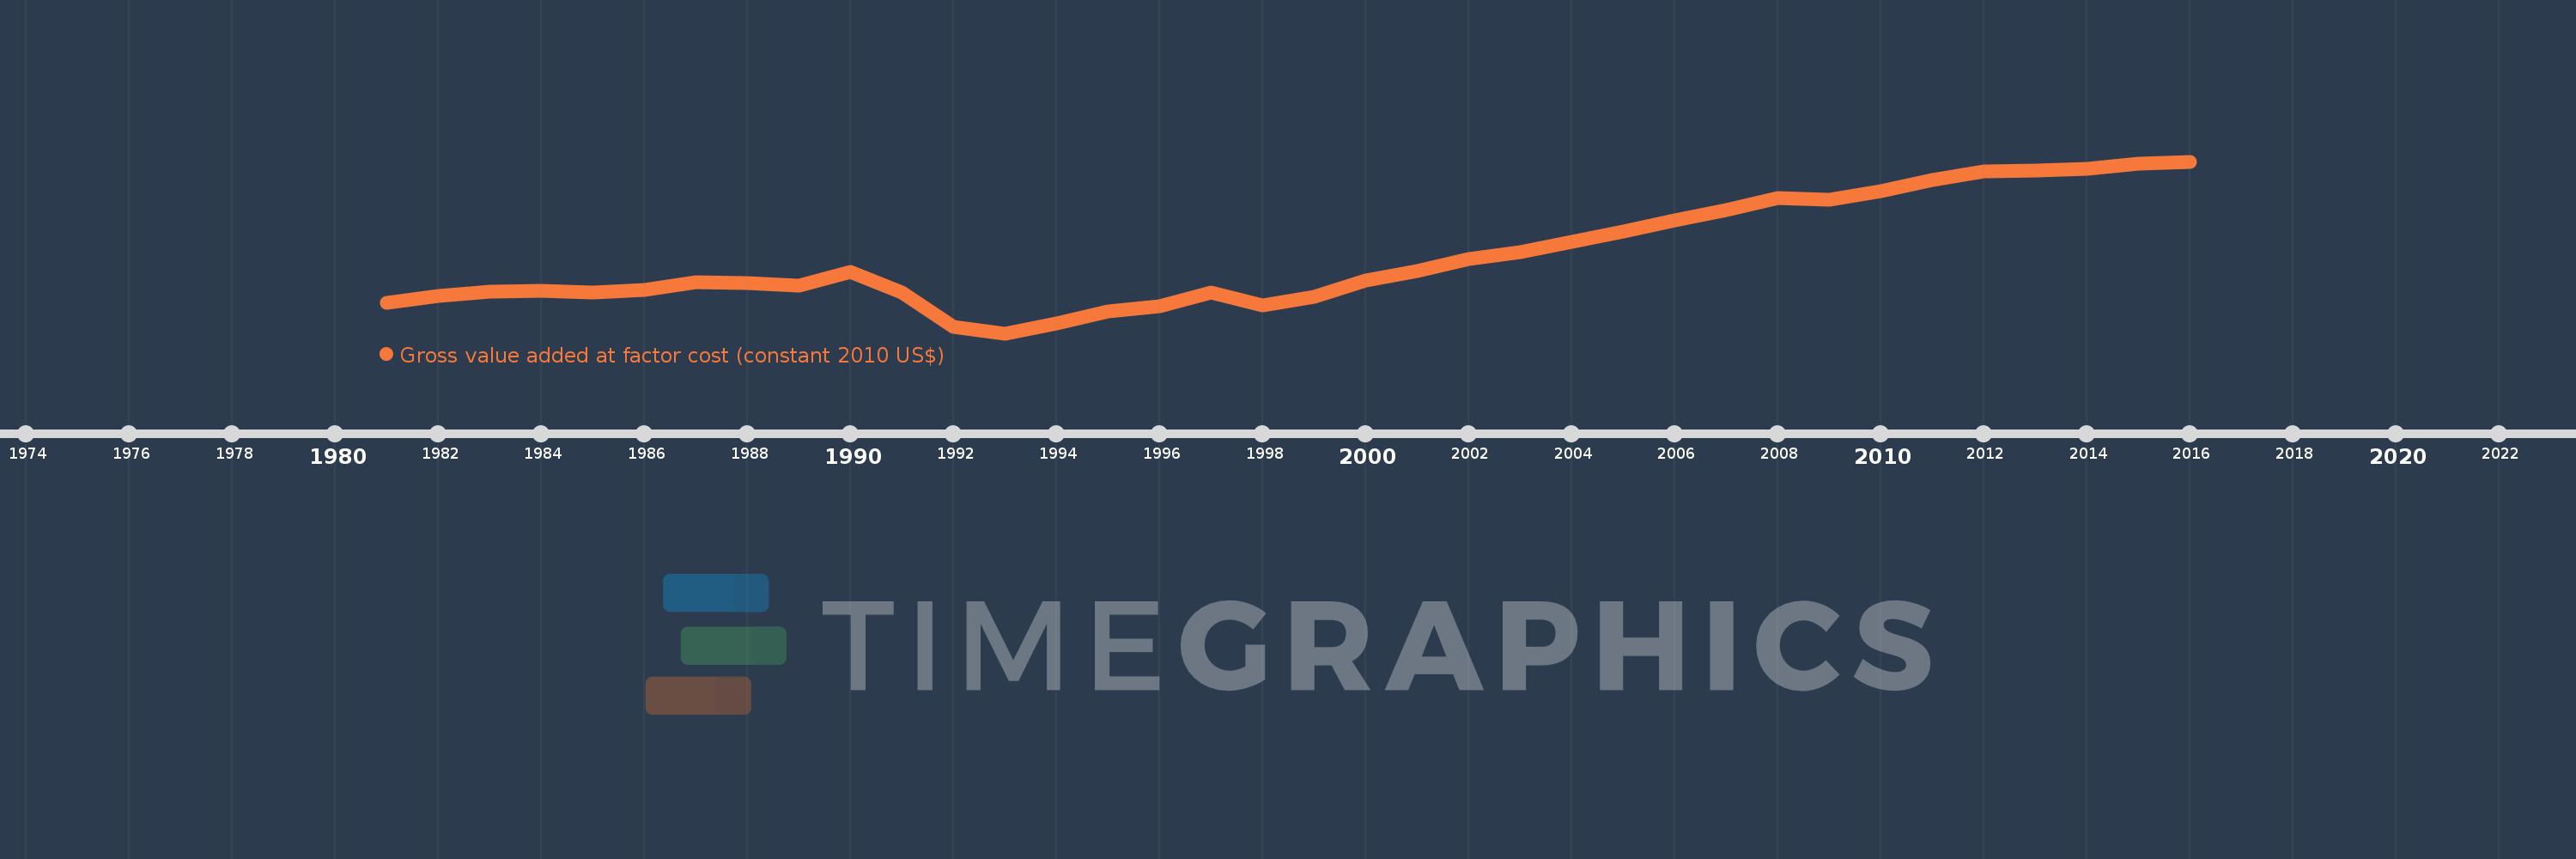
Gross value added at factor cost (constant 2010 US$)
2016,2015,2014,2013,2012,2011,2010,2009,2008,2007,2006,2005,2004,2003,2002,2001,2000,1999,1998,1997,1996,1995,1994,1993,1992,1991,1990,1989,1988,1987,1986,1985,1984,1983,1982,1981
This statistics in other country:
AfghanistanAlbaniaAlgeriaAndorraAntigua and BarbudaArgentinaArmeniaArubaAustraliaAustriaAzerbaijanBahamas, TheBangladeshBarbadosBelarusBelgiumBelizeBeninBermudaBhutanBoliviaBosnia and HerzegovinaBotswanaBrazilBulgariaBurkina FasoBurundiCabo VerdeCambodiaCameroonCanadaCaribbean small statesCentral African RepublicCentral Europe and the BalticsChadChileColombiaCongo, Dem. Rep.Costa RicaCroatiaCubaCyprusCzech RepublicDenmarkDominicaDominican RepublicEarly-demographic dividendEcuadorEgypt, Arab Rep.El SalvadorEquatorial GuineaEstoniaEthiopiaEuro areaEurope & Central AsiaEurope & Central Asia (excluding high income)Europe & Central Asia (IDA & IBRD countries)European UnionFaroe IslandsFijiFinlandFranceGabonGambia, TheGeorgiaGermanyGhanaGreeceGrenadaGuatemalaGuineaGuinea-BissauGuyanaHeavily indebted poor countries (HIPC)High incomeHondurasHong Kong SAR, ChinaHungaryIcelandIDA blendIDA onlyIDA totalIndiaIndonesiaIran, Islamic Rep.IrelandItalyJamaicaJapanJordanKazakhstanKenyaKiribatiKorea, Rep.KosovoKuwaitKyrgyz RepublicLao PDRLatin America & Caribbean Latin America & Caribbean (excluding high income)Latin America & the Caribbean (IDA & IBRD countries)LatviaLeast developed countries: UN classificationLebanonLesothoLiechtensteinLithuaniaLow incomeLower middle incomeLuxembourgMacao SAR, ChinaMacedonia, FYRMadagascarMalawiMaldivesMaliMaltaMarshall IslandsMauritaniaMauritiusMexicoMicronesia, Fed. Sts.Middle East & North Africa (excluding high income)Middle East & North Africa (IDA & IBRD countries)MoldovaMongoliaMontenegroMoroccoMozambiqueNamibiaNepalNetherlandsNew ZealandNicaraguaNigeriaNorth AmericaNorwayOECD membersPacific island small statesPakistanPalauPanamaParaguayPeruPolandPortugalPost-demographic dividendPre-demographic dividendRomaniaRussian FederationRwandaSao Tome and PrincipeSenegalSerbiaSeychellesSierra LeoneSingaporeSlovak RepublicSloveniaSouth AfricaSouth AsiaSouth Asia (IDA & IBRD)SpainSri LankaSt. Kitts and NevisSt. LuciaSt. Vincent and the GrenadinesSub-Saharan Africa Sub-Saharan Africa (excluding high income)Sub-Saharan Africa (IDA & IBRD countries)SudanSurinameSwazilandSwedenSwitzerlandTajikistanTanzaniaThailandTimor-LesteTongaTrinidad and TobagoTunisiaTurkeyTurkmenistanTuvaluUgandaUkraineUnited KingdomUnited StatesUruguayUzbekistanVanuatuVenezuela, RBVietnamWest Bank and GazaWorldZambiaZimbabwe Timeline:
This timeline shows a graph from 1981 to 2016 of Albania. No data until 1980. Number of actual observations by date: 36.
Source name:
World Development Indicators
Source organization:
World Bank national accounts data, and OECD National Accounts data files.
Categories, topics:
Economy & Growth
Last updated:
apr 23, 2017
Indicators value changes by year
Minimum:
3.847 bln
jan 1, 1993
Maximum:
11.138 bln
jan 1, 2016
At the date of observation
Value
Absolute change
Change from previous value
jan 1, 1981
5.142 bln
+5.142 bln
0.0%
jan 1, 1982
5.437 bln
+295.431 mln
5.75%
jan 1, 1983
5.598 bln
+160.323 mln
2.95%
jan 1, 1984
5.659 bln
+61.85 mln
1.1%
jan 1, 1985
5.589 bln
-70.834 mln
-1.25%
jan 1, 1986
5.688 bln
+99.513 mln
1.78%
jan 1, 1987
6.009 bln
+320.654 mln
5.64%
jan 1, 1988
5.961 bln
-47.34 mln
-0.79%
jan 1, 1989
5.877 bln
-84.655 mln
-1.42%
jan 1, 1990
6.455 bln
+578.073 mln
9.84%
jan 1, 1991
5.563 bln
-891.876 mln
-13.82%
jan 1, 1992
4.134 bln
-1.429 bln
-25.68%
jan 1, 1993
3.847 bln
-287.479 mln
-6.95%
jan 1, 1994
4.271 bln
+424.499 mln
11.03%
jan 1, 1995
4.761 bln
+489.775 mln
11.47%
jan 1, 1996
4.992 bln
+230.543 mln
4.84%
jan 1, 1997
5.596 bln
+604.007 mln
12.1%
jan 1, 1998
5.042 bln
-553.438 mln
-9.89%
jan 1, 1999
5.382 bln
+339.687 mln
6.74%
jan 1, 2000
6.1 bln
+718.39 mln
13.35%
jan 1, 2001
6.472 bln
+371.97 mln
6.1%
jan 1, 2002
6.985 bln
+512.475 mln
7.92%
jan 1, 2003
7.29 bln
+304.907 mln
4.37%
jan 1, 2004
7.724 bln
+434.491 mln
5.96%
jan 1, 2005
8.165 bln
+441.13 mln
5.71%
jan 1, 2006
8.631 bln
+465.269 mln
5.7%
jan 1, 2007
9.096 bln
+465.857 mln
5.4%
jan 1, 2008
9.586 bln
+489.93 mln
5.39%
jan 1, 2009
9.519 bln
-67.162 mln
-0.7%
jan 1, 2010
9.884 bln
+364.743 mln
3.83%
jan 1, 2011
10.367 bln
+482.825 mln
4.88%
jan 1, 2012
10.731 bln
+364.525 mln
3.52%
jan 1, 2013
10.762 bln
+30.891 mln
0.29%
jan 1, 2014
10.825 bln
+62.371 mln
0.58%
jan 1, 2015
11.04 bln
+215.594 mln
1.99%
jan 1, 2016
11.138 bln
+98.178 mln
0.89%
Ranking of countries by current statistics by years


Comments: