29
/
en
AIzaSyAYiBZKx7MnpbEhh9jyipgxe19OcubqV5w
April 1, 2024
64724
Albania
ALB
true
2
1
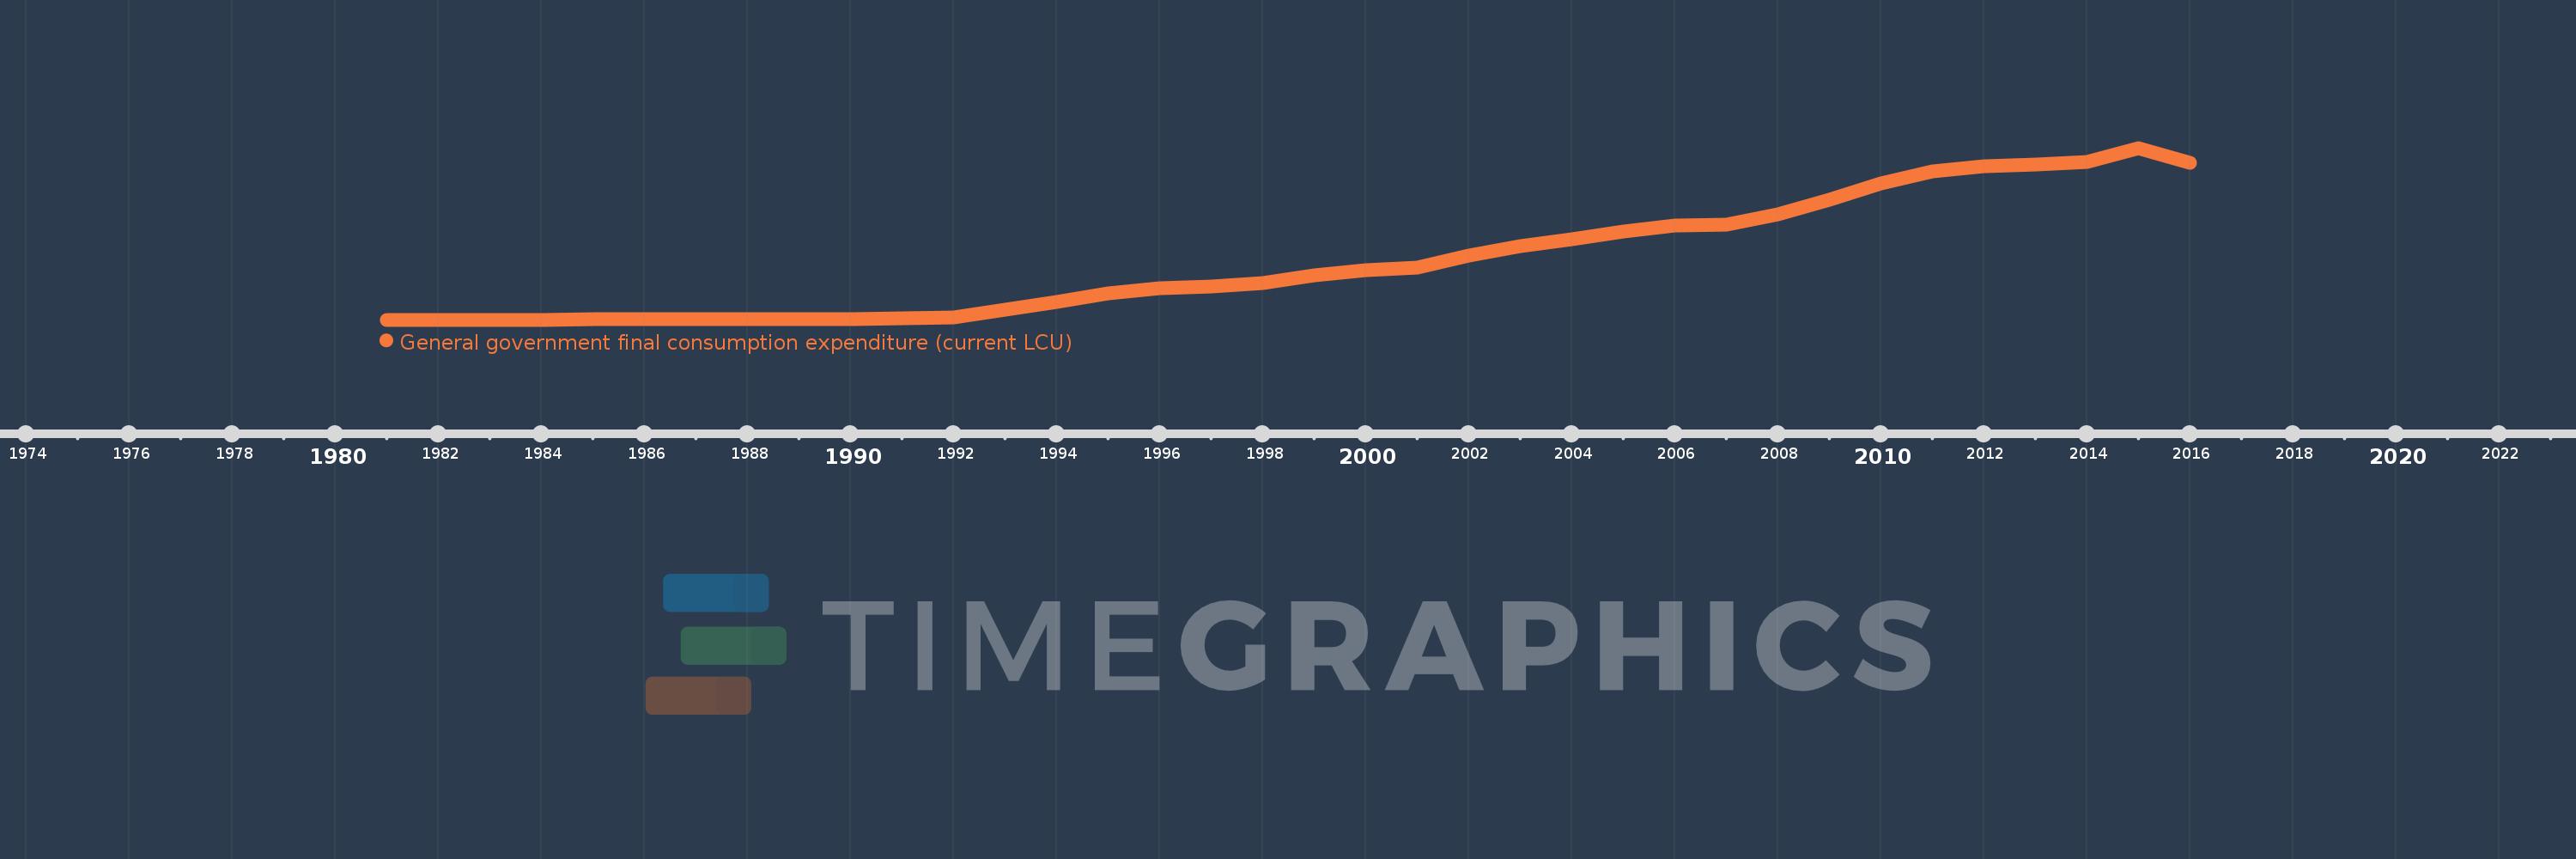
General government final consumption expenditure (current LCU)
2016,2015,2014,2013,2012,2011,2010,2009,2008,2007,2006,2005,2004,2003,2002,2001,2000,1999,1998,1997,1996,1995,1994,1993,1992,1991,1990,1989,1988,1987,1986,1985,1984,1983,1982,1981
This statistics in other country:
AfghanistanAlbaniaAlgeriaAngolaAntigua and BarbudaArgentinaArmeniaArubaAustraliaAustriaAzerbaijanBahamas, TheBahrainBangladeshBarbadosBelarusBelgiumBelizeBeninBermudaBhutanBoliviaBosnia and HerzegovinaBotswanaBrazilBrunei DarussalamBulgariaBurkina FasoBurundiCabo VerdeCambodiaCameroonCanadaCentral African RepublicChadChileChinaColombiaComorosCongo, Dem. Rep.Congo, Rep.Costa RicaCote d'IvoireCroatiaCubaCyprusCzech RepublicDenmarkDjiboutiDominicaDominican RepublicEcuadorEgypt, Arab Rep.El SalvadorEquatorial GuineaEritreaEstoniaEthiopiaFaroe IslandsFijiFinlandFranceFrench PolynesiaGabonGambia, TheGeorgiaGermanyGhanaGreeceGrenadaGuatemalaGuineaGuinea-BissauGuyanaHaitiHondurasHong Kong SAR, ChinaHungaryIcelandIndiaIndonesiaIran, Islamic Rep.IraqIrelandIsraelItalyJamaicaJapanJordanKazakhstanKenyaKiribatiKorea, Rep.KosovoKuwaitKyrgyz RepublicLao PDRLatviaLebanonLesothoLiberiaLibyaLithuaniaLuxembourgMacao SAR, ChinaMacedonia, FYRMadagascarMalawiMalaysiaMaldivesMaliMaltaMauritaniaMauritiusMexicoMicronesia, Fed. Sts.MoldovaMongoliaMontenegroMoroccoMozambiqueNamibiaNepalNetherlandsNew CaledoniaNew ZealandNicaraguaNigerNigeriaNorwayOmanPakistanPanamaPapua New GuineaParaguayPeruPhilippinesPolandPortugalPuerto RicoQatarRomaniaRussian FederationRwandaSaudi ArabiaSenegalSerbiaSeychellesSierra LeoneSingaporeSlovak RepublicSloveniaSolomon IslandsSomaliaSouth AfricaSouth SudanSpainSri LankaSt. Kitts and NevisSt. LuciaSt. Vincent and the GrenadinesSudanSurinameSwazilandSwedenSwitzerlandSyrian Arab RepublicTajikistanTanzaniaThailandTimor-LesteTogoTongaTrinidad and TobagoTunisiaTurkeyTurkmenistanUgandaUkraineUnited Arab EmiratesUnited KingdomUnited StatesUruguayUzbekistanVanuatuVenezuela, RBVietnamWest Bank and GazaYemen, Rep.ZambiaZimbabwe Timeline:
This timeline shows a graph from 1981 to 2016 of Albania. No data until 1980. Number of actual observations by date: 36.
Source name:
World Development Indicators
Source organization:
World Bank national accounts data, and OECD National Accounts data files.
Categories, topics:
Economy & Growth
Last updated:
apr 23, 2017
Indicators value changes by year
Minimum:
1.372 bln
jan 1, 1982
Maximum:
159.789 bln
jan 1, 2015
At the date of observation
Value
Absolute change
Change from previous value
jan 1, 1981
1.396 bln
+1.396 bln
0.0%
jan 1, 1982
1.372 bln
-24.0 mln
-1.72%
jan 1, 1983
1.421 bln
+49.0 mln
3.57%
jan 1, 1984
1.468 bln
+47.0 mln
3.31%
jan 1, 1985
1.554 bln
+86.0 mln
5.86%
jan 1, 1986
1.569 bln
+15.0 mln
0.97%
jan 1, 1987
1.613 bln
+44.0 mln
2.8%
jan 1, 1988
1.664 bln
+51.0 mln
3.16%
jan 1, 1989
1.609 bln
-55.0 mln
-3.31%
jan 1, 1990
1.646 bln
+37.0 mln
2.3%
jan 1, 1991
3.114 bln
+1.468 bln
89.19%
jan 1, 1992
3.622 bln
+508.0 mln
16.31%
jan 1, 1993
10.476 bln
+6.854 bln
189.23%
jan 1, 1994
17.709 bln
+7.233 bln
69.04%
jan 1, 1995
26.027 bln
+8.318 bln
46.97%
jan 1, 1996
30.669 bln
+4.642 bln
17.84%
jan 1, 1997
31.852 bln
+1.183 bln
3.86%
jan 1, 1998
35.167 bln
+3.315 bln
10.41%
jan 1, 1999
41.987 bln
+6.82 bln
19.39%
jan 1, 2000
47.023 bln
+5.036 bln
11.99%
jan 1, 2001
49.454 bln
+2.431 bln
5.17%
jan 1, 2002
60.667 bln
+11.214 bln
22.68%
jan 1, 2003
69.572 bln
+8.904 bln
14.68%
jan 1, 2004
75.585 bln
+6.014 bln
8.64%
jan 1, 2005
82.484 bln
+6.898 bln
9.13%
jan 1, 2006
88.508 bln
+6.024 bln
7.3%
jan 1, 2007
89.411 bln
+903.238 mln
1.02%
jan 1, 2008
98.352 bln
+8.94 bln
10.0%
jan 1, 2009
112.163 bln
+13.811 bln
14.04%
jan 1, 2010
127.085 bln
+14.922 bln
13.3%
jan 1, 2011
138.312 bln
+11.227 bln
8.83%
jan 1, 2012
142.733 bln
+4.421 bln
3.2%
jan 1, 2013
144.541 bln
+1.808 bln
1.27%
jan 1, 2014
146.798 bln
+2.257 bln
1.56%
jan 1, 2015
159.789 bln
+12.992 bln
8.85%
jan 1, 2016
146.05 bln
-13.739 bln
-8.6%
Ranking of countries by current statistics by years


Comments: