29
/
en
AIzaSyAYiBZKx7MnpbEhh9jyipgxe19OcubqV5w
April 1, 2024
62821
World
WLD
false
2
1
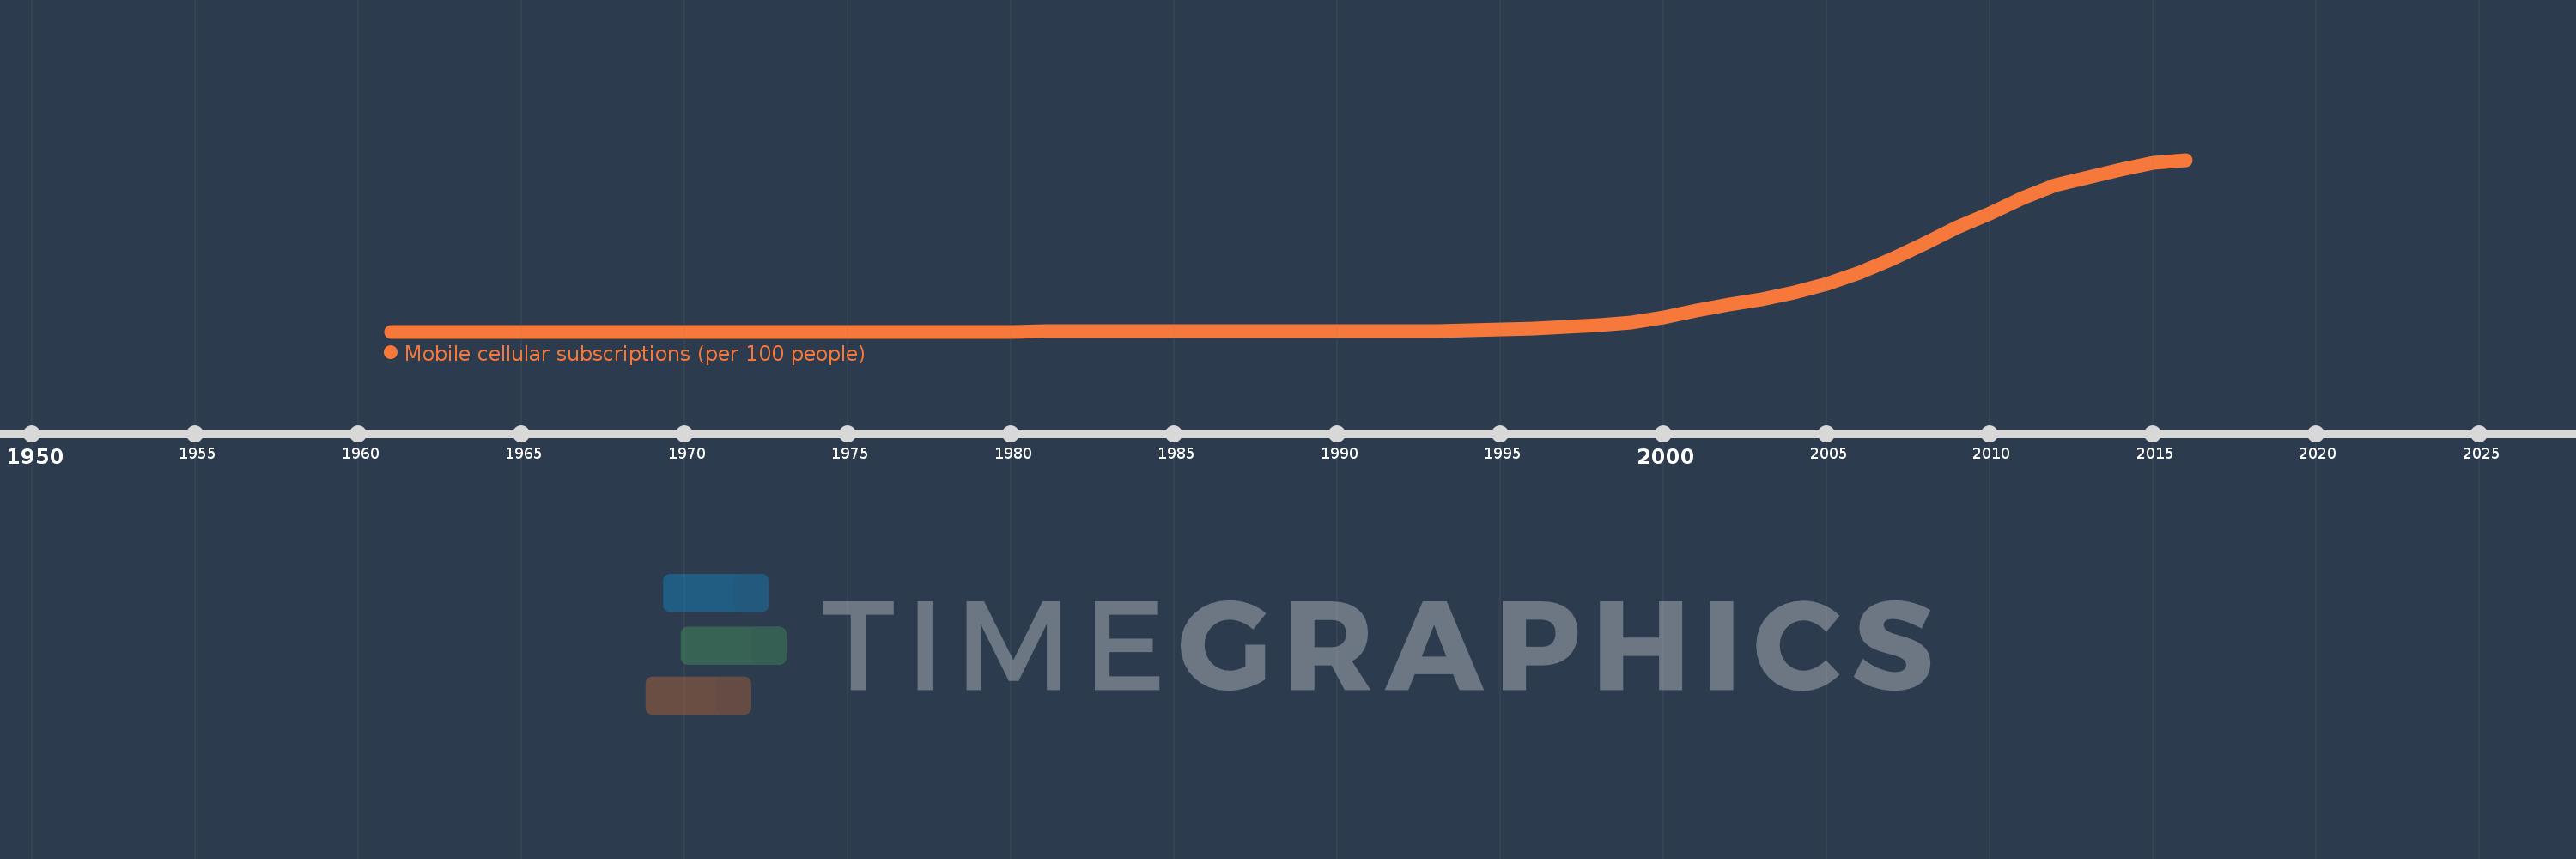
Mobile cellular subscriptions (per 100 people)
2016,2015,2014,2013,2012,2011,2010,2009,2008,2007,2006,2005,2004,2003,2002,2001,2000,1999,1998,1997,1996,1995,1994,1993,1992,1991,1990,1989,1988,1987,1986,1985,1984,1983,1982,1981,1980,1979,1978,1977,1976,1971,1966,1961
This statistics in other country:
AfghanistanAlbaniaAlgeriaAmerican SamoaAndorraAngolaAntigua and BarbudaArab WorldArgentinaArmeniaArubaAustraliaAustriaAzerbaijanBahamas, TheBahrainBangladeshBarbadosBelarusBelgiumBelizeBeninBermudaBhutanBoliviaBosnia and HerzegovinaBotswanaBrazilBritish Virgin IslandsBrunei DarussalamBulgariaBurkina FasoBurundiCabo VerdeCambodiaCameroonCanadaCaribbean small statesCayman IslandsCentral African RepublicCentral Europe and the BalticsChadChileChinaColombiaComorosCongo, Dem. Rep.Congo, Rep.Costa RicaCote d'IvoireCroatiaCubaCuracaoCyprusCzech RepublicDenmarkDjiboutiDominicaDominican RepublicEarly-demographic dividendEast Asia & PacificEast Asia & Pacific (excluding high income)East Asia & Pacific (IDA & IBRD countries)EcuadorEgypt, Arab Rep.El SalvadorEquatorial GuineaEritreaEstoniaEthiopiaEuro areaEurope & Central AsiaEurope & Central Asia (excluding high income)Europe & Central Asia (IDA & IBRD countries)European UnionFaroe IslandsFijiFinlandFragile and conflict affected situationsFranceFrench PolynesiaGabonGambia, TheGeorgiaGermanyGhanaGibraltarGreeceGreenlandGrenadaGuamGuatemalaGuineaGuinea-BissauGuyanaHaitiHeavily indebted poor countries (HIPC)High incomeHondurasHong Kong SAR, ChinaHungaryIBRD onlyIcelandIDA & IBRD totalIDA blendIDA onlyIDA totalIndiaIndonesiaIran, Islamic Rep.IraqIrelandIsraelItalyJamaicaJapanJordanKazakhstanKenyaKiribatiKorea, Dem. People’s Rep.Korea, Rep.KosovoKuwaitKyrgyz RepublicLao PDRLate-demographic dividendLatin America & Caribbean Latin America & Caribbean (excluding high income)Latin America & the Caribbean (IDA & IBRD countries)LatviaLeast developed countries: UN classificationLebanonLesothoLiberiaLibyaLiechtensteinLithuaniaLow & middle incomeLow incomeLower middle incomeLuxembourgMacao SAR, ChinaMacedonia, FYRMadagascarMalawiMalaysiaMaldivesMaliMaltaMarshall IslandsMauritaniaMauritiusMexicoMicronesia, Fed. Sts.Middle East & North AfricaMiddle East & North Africa (excluding high income)Middle East & North Africa (IDA & IBRD countries)Middle incomeMoldovaMonacoMongoliaMontenegroMoroccoMozambiqueMyanmarNamibiaNauruNepalNetherlandsNew CaledoniaNew ZealandNicaraguaNigerNigeriaNorth AmericaNorthern Mariana IslandsNorwayOECD membersOmanOther small statesPacific island small statesPakistanPalauPanamaPapua New GuineaParaguayPeruPhilippinesPolandPortugalPost-demographic dividendPre-demographic dividendPuerto RicoQatarRomaniaRussian FederationRwandaSamoaSan MarinoSao Tome and PrincipeSaudi ArabiaSenegalSerbiaSeychellesSierra LeoneSingaporeSint Maarten (Dutch part)Slovak RepublicSloveniaSmall statesSolomon IslandsSomaliaSouth AfricaSouth AsiaSouth Asia (IDA & IBRD)South SudanSpainSri LankaSt. Kitts and NevisSt. LuciaSt. Vincent and the GrenadinesSub-Saharan Africa Sub-Saharan Africa (excluding high income)Sub-Saharan Africa (IDA & IBRD countries)SudanSurinameSwazilandSwedenSwitzerlandSyrian Arab RepublicTajikistanTanzaniaThailandTimor-LesteTogoTongaTrinidad and TobagoTunisiaTurkeyTurkmenistanTurks and Caicos IslandsTuvaluUgandaUkraineUnited Arab EmiratesUnited KingdomUnited StatesUpper middle incomeUruguayUzbekistanVanuatuVenezuela, RBVietnamVirgin Islands (U.S.)West Bank and GazaWorldYemen, Rep.ZambiaZimbabwe Timeline:
This timeline shows a graph from 1961 to 2016 of World. No data until 1960. Number of actual observations by date: 44.
Source name:
World Development Indicators
Source organization:
International Telecommunication Union, World Telecommunication/ICT Development Report and database.
Categories, topics:
Infrastructure
Last updated:
apr 23, 2017
Indicators value changes by year
Maximum:
98.622
jan 1, 2016
At the date of observation
Value
Absolute change
Change from previous value
jan 1, 1981
0.001
+0.001
%
jan 1, 1982
0.001
+0.001
180.57%
jan 1, 1983
0.002
+0.001
56.77%
jan 1, 1984
0.003
+0.001
45.27%
jan 1, 1985
0.007
+0.003
102.31%
jan 1, 1986
0.016
+0.009
131.3%
jan 1, 1987
0.03
+0.014
86.11%
jan 1, 1988
0.051
+0.021
72.19%
jan 1, 1989
0.085
+0.034
66.88%
jan 1, 1990
0.142
+0.057
66.92%
jan 1, 1991
0.211
+0.069
48.98%
jan 1, 1992
0.302
+0.091
42.93%
jan 1, 1993
0.427
+0.125
41.5%
jan 1, 1994
0.618
+0.191
44.79%
jan 1, 1995
0.99
+0.372
60.16%
jan 1, 1996
1.585
+0.595
60.07%
jan 1, 1997
2.499
+0.914
57.66%
jan 1, 1998
3.657
+1.158
46.32%
jan 1, 1999
5.339
+1.683
46.01%
jan 1, 2000
8.137
+2.798
52.4%
jan 1, 2001
12.075
+3.938
48.39%
jan 1, 2002
15.526
+3.451
28.58%
jan 1, 2003
18.581
+3.055
19.68%
jan 1, 2004
22.306
+3.725
20.05%
jan 1, 2005
27.401
+5.094
22.84%
jan 1, 2006
33.913
+6.512
23.77%
jan 1, 2007
41.762
+7.85
23.15%
jan 1, 2008
50.52
+8.758
20.97%
jan 1, 2009
59.7
+9.179
18.17%
jan 1, 2010
67.888
+8.188
13.72%
jan 1, 2011
76.514
+8.626
12.71%
jan 1, 2012
84.231
+7.717
10.09%
jan 1, 2013
88.496
+4.265
5.06%
jan 1, 2014
93.096
+4.601
5.2%
jan 1, 2015
96.827
+3.73
4.01%
jan 1, 2016
98.622
+1.795
1.85%
Ranking of countries by current statistics by years


Comments: