29
/
en
AIzaSyAYiBZKx7MnpbEhh9jyipgxe19OcubqV5w
April 1, 2024
62483
World
WLD
false
2
1
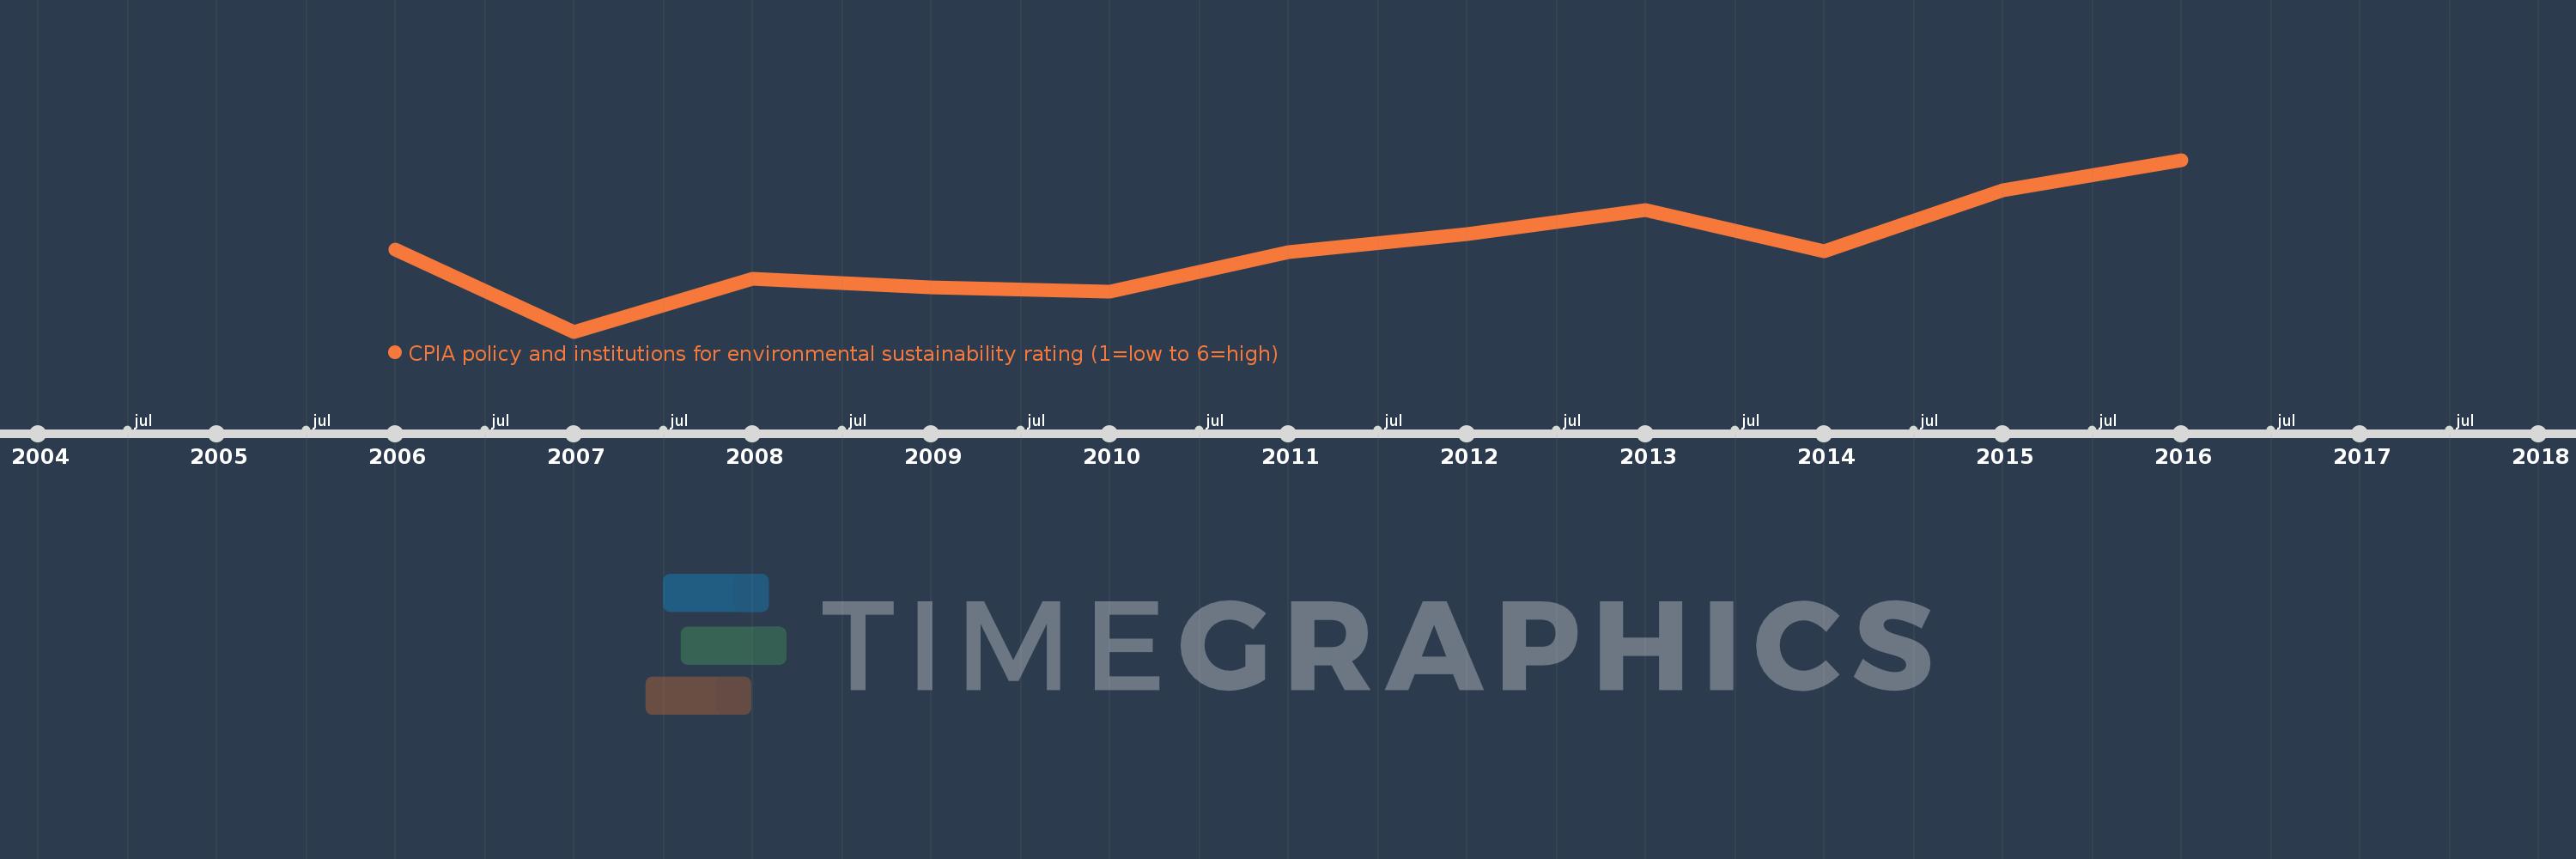
CPIA policy and institutions for environmental sustainability rating (1=low to 6=high)
2016,2015,2014,2013,2012,2011,2010,2009,2008,2007,2006
This statistics in other country:
Timeline:
This timeline shows a graph from 2006 to 2016 of World. No data until 2005. Number of actual observations by date: 11.
Source name:
World Development Indicators
Source organization:
World Bank Group, CPIA database (http://www.worldbank.org/ida).
Categories, topics:
Public Sector
Last updated:
apr 23, 2017
Indicators value changes by year
At the date of observation
Value
Absolute change
Change from previous value
jan 1, 2006
3.112
+3.112
0.0%
jan 1, 2007
3.058
-0.054
-1.74%
jan 1, 2008
3.093
+0.036
1.17%
jan 1, 2009
3.087
-0.007
-0.22%
jan 1, 2010
3.084
-0.002
-0.07%
jan 1, 2011
3.11
+0.026
0.84%
jan 1, 2012
3.122
+0.011
0.37%
jan 1, 2013
3.138
+0.016
0.5%
jan 1, 2014
3.111
-0.026
-0.84%
jan 1, 2015
3.151
+0.04
1.29%
jan 1, 2016
3.171
+0.02
0.63%
Ranking of countries by current statistics by years


Comments: