29
/
en
AIzaSyAYiBZKx7MnpbEhh9jyipgxe19OcubqV5w
April 1, 2024
62250
Upper middle income
UMC
false
2
1
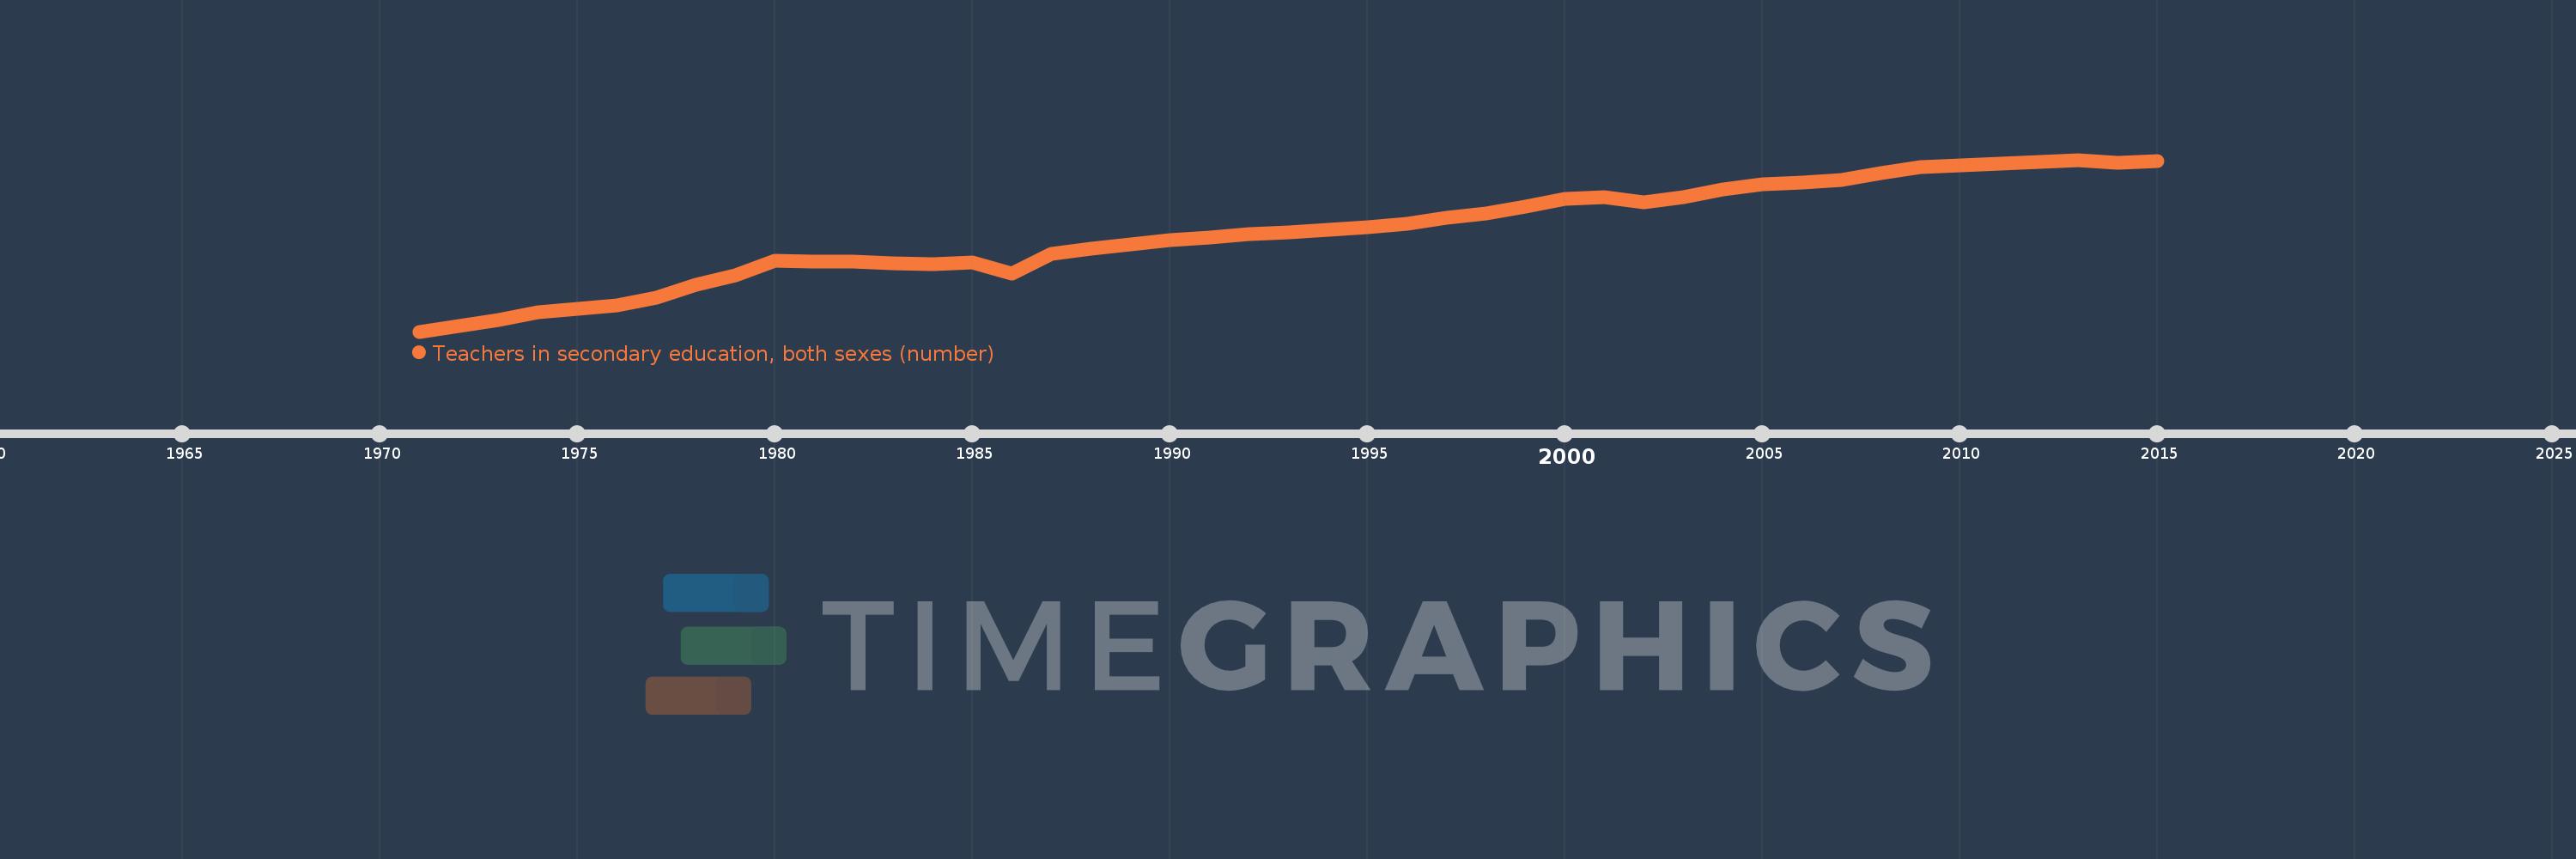
Teachers in secondary education, both sexes (number)
2015,2014,2013,2012,2011,2010,2009,2008,2007,2006,2005,2004,2003,2002,2001,2000,1999,1998,1997,1996,1995,1994,1993,1992,1991,1990,1989,1988,1987,1986,1985,1984,1983,1982,1981,1980,1979,1978,1977,1976,1975,1974,1973,1972,1971
This statistics in other country:
AfghanistanAlbaniaAlgeriaAmerican SamoaAndorraAngolaAntigua and BarbudaArab WorldArgentinaArmeniaArubaAustraliaAustriaBahamas, TheBahrainBangladeshBarbadosBelarusBelgiumBelizeBeninBermudaBhutanBoliviaBosnia and HerzegovinaBotswanaBrazilBritish Virgin IslandsBrunei DarussalamBulgariaBurkina FasoBurundiCabo VerdeCambodiaCameroonCanadaCaribbean small statesCayman IslandsCentral African RepublicCentral Europe and the BalticsChadChileChinaColombiaComorosCongo, Dem. Rep.Congo, Rep.Costa RicaCote d'IvoireCroatiaCubaCyprusCzech RepublicDenmarkDjiboutiDominicaDominican RepublicEarly-demographic dividendEast Asia & PacificEast Asia & Pacific (excluding high income)East Asia & Pacific (IDA & IBRD countries)EcuadorEgypt, Arab Rep.El SalvadorEquatorial GuineaEritreaEstoniaEthiopiaEuro areaEurope & Central AsiaEurope & Central Asia (excluding high income)Europe & Central Asia (IDA & IBRD countries)European UnionFijiFinlandFragile and conflict affected situationsFranceFrench PolynesiaGabonGambia, TheGeorgiaGermanyGhanaGibraltarGreeceGrenadaGuamGuatemalaGuineaGuinea-BissauGuyanaHaitiHeavily indebted poor countries (HIPC)High incomeHondurasHong Kong SAR, ChinaHungaryIBRD onlyIcelandIDA & IBRD totalIDA blendIDA onlyIDA totalIndiaIndonesiaIran, Islamic Rep.IraqIrelandIsraelItalyJamaicaJapanJordanKazakhstanKenyaKiribatiKorea, Dem. People’s Rep.Korea, Rep.KuwaitKyrgyz RepublicLao PDRLate-demographic dividendLatin America & Caribbean Latin America & Caribbean (excluding high income)Latin America & the Caribbean (IDA & IBRD countries)LatviaLeast developed countries: UN classificationLebanonLesothoLiberiaLibyaLiechtensteinLithuaniaLow & middle incomeLow incomeLower middle incomeLuxembourgMacao SAR, ChinaMacedonia, FYRMadagascarMalawiMalaysiaMaldivesMaliMaltaMarshall IslandsMauritaniaMauritiusMexicoMiddle East & North AfricaMiddle East & North Africa (excluding high income)Middle East & North Africa (IDA & IBRD countries)Middle incomeMoldovaMonacoMongoliaMoroccoMozambiqueMyanmarNamibiaNauruNepalNetherlandsNew CaledoniaNew ZealandNicaraguaNigerNigeriaNorth AmericaNorwayOECD membersOmanOther small statesPacific island small statesPakistanPalauPanamaPapua New GuineaParaguayPeruPhilippinesPolandPortugalPost-demographic dividendPre-demographic dividendPuerto RicoQatarRomaniaRussian FederationRwandaSamoaSan MarinoSao Tome and PrincipeSaudi ArabiaSenegalSerbiaSeychellesSierra LeoneSingaporeSint Maarten (Dutch part)Slovak RepublicSloveniaSmall statesSolomon IslandsSomaliaSouth AfricaSouth AsiaSouth Asia (IDA & IBRD)SpainSri LankaSt. Kitts and NevisSt. LuciaSt. Vincent and the GrenadinesSub-Saharan Africa Sub-Saharan Africa (excluding high income)Sub-Saharan Africa (IDA & IBRD countries)SudanSurinameSwazilandSwedenSwitzerlandSyrian Arab RepublicTajikistanTanzaniaThailandTimor-LesteTogoTongaTrinidad and TobagoTunisiaTurkeyTurks and Caicos IslandsUgandaUkraineUnited Arab EmiratesUnited KingdomUnited StatesUpper middle incomeUruguayUzbekistanVanuatuVenezuela, RBVietnamVirgin Islands (U.S.)West Bank and GazaWorldYemen, Rep.ZambiaZimbabwe Timeline:
This timeline shows a graph from 1971 to 2015 of Upper middle income. No data until 1970. Number of actual observations by date: 45.
Source name:
World Development Indicators
Source organization:
UNESCO Institute for Statistics
Categories, topics:
Education
Last updated:
apr 23, 2017
Indicators value changes by year
Minimum:
4.457 mln
jan 1, 1971
Maximum:
13.724 mln
jan 1, 2013
At the date of observation
Value
Absolute change
Change from previous value
jan 1, 1971
4.457 mln
+4.457 mln
0.0%
jan 1, 1972
4.762 mln
+305.011K
6.84%
jan 1, 1973
5.06 mln
+298.163K
6.26%
jan 1, 1974
5.486 mln
+425.717K
8.41%
jan 1, 1975
5.703 mln
+217.062K
3.96%
jan 1, 1976
5.864 mln
+160.271K
2.81%
jan 1, 1977
6.282 mln
+418.707K
7.14%
jan 1, 1978
7.005 mln
+723.14K
11.51%
jan 1, 1979
7.509 mln
+503.709K
7.19%
jan 1, 1980
8.302 mln
+793.167K
10.56%
jan 1, 1981
8.221 mln
-81.346K
-0.98%
jan 1, 1982
8.237 mln
+15.674K
0.19%
jan 1, 1983
8.136 mln
-100.344K
-1.22%
jan 1, 1984
8.097 mln
-39.077K
-0.48%
jan 1, 1985
8.187 mln
+89.424K
1.1%
jan 1, 1986
7.568 mln
-619.045K
-7.56%
jan 1, 1987
8.628 mln
+1.061 mln
14.02%
jan 1, 1988
8.927 mln
+298.764K
3.46%
jan 1, 1989
9.181 mln
+253.883K
2.84%
jan 1, 1990
9.398 mln
+216.678K
2.36%
jan 1, 1991
9.534 mln
+136.09K
1.45%
jan 1, 1992
9.699 mln
+164.643K
1.73%
jan 1, 1993
9.813 mln
+114.509K
1.18%
jan 1, 1994
9.946 mln
+132.96K
1.35%
jan 1, 1995
10.098 mln
+152.106K
1.53%
jan 1, 1996
10.265 mln
+167.146K
1.66%
jan 1, 1997
10.615 mln
+349.362K
3.4%
jan 1, 1998
10.813 mln
+198.026K
1.87%
jan 1, 1999
11.216 mln
+403.095K
3.73%
jan 1, 2000
11.593 mln
+377.433K
3.37%
jan 1, 2001
11.713 mln
+120.166K
1.04%
jan 1, 2002
11.452 mln
-261.784K
-2.23%
jan 1, 2003
11.714 mln
+262.191K
2.29%
jan 1, 2004
12.144 mln
+430.156K
3.67%
jan 1, 2005
12.387 mln
+242.795K
2.0%
jan 1, 2006
12.486 mln
+98.808K
0.8%
jan 1, 2007
12.653 mln
+167.76K
1.34%
jan 1, 2008
13.026 mln
+372.618K
2.94%
jan 1, 2009
13.31 mln
+283.725K
2.18%
jan 1, 2010
13.438 mln
+128.494K
0.97%
jan 1, 2011
13.515 mln
+76.542K
0.57%
jan 1, 2012
13.588 mln
+73.393K
0.54%
jan 1, 2013
13.724 mln
+136.365K
1.0%
jan 1, 2014
13.556 mln
-168.703K
-1.23%
jan 1, 2015
13.661 mln
+104.958K
0.77%
Ranking of countries by current statistics by years


Comments: