29
/
en
AIzaSyAYiBZKx7MnpbEhh9jyipgxe19OcubqV5w
April 1, 2024
62124
Upper middle income
UMC
false
2
1
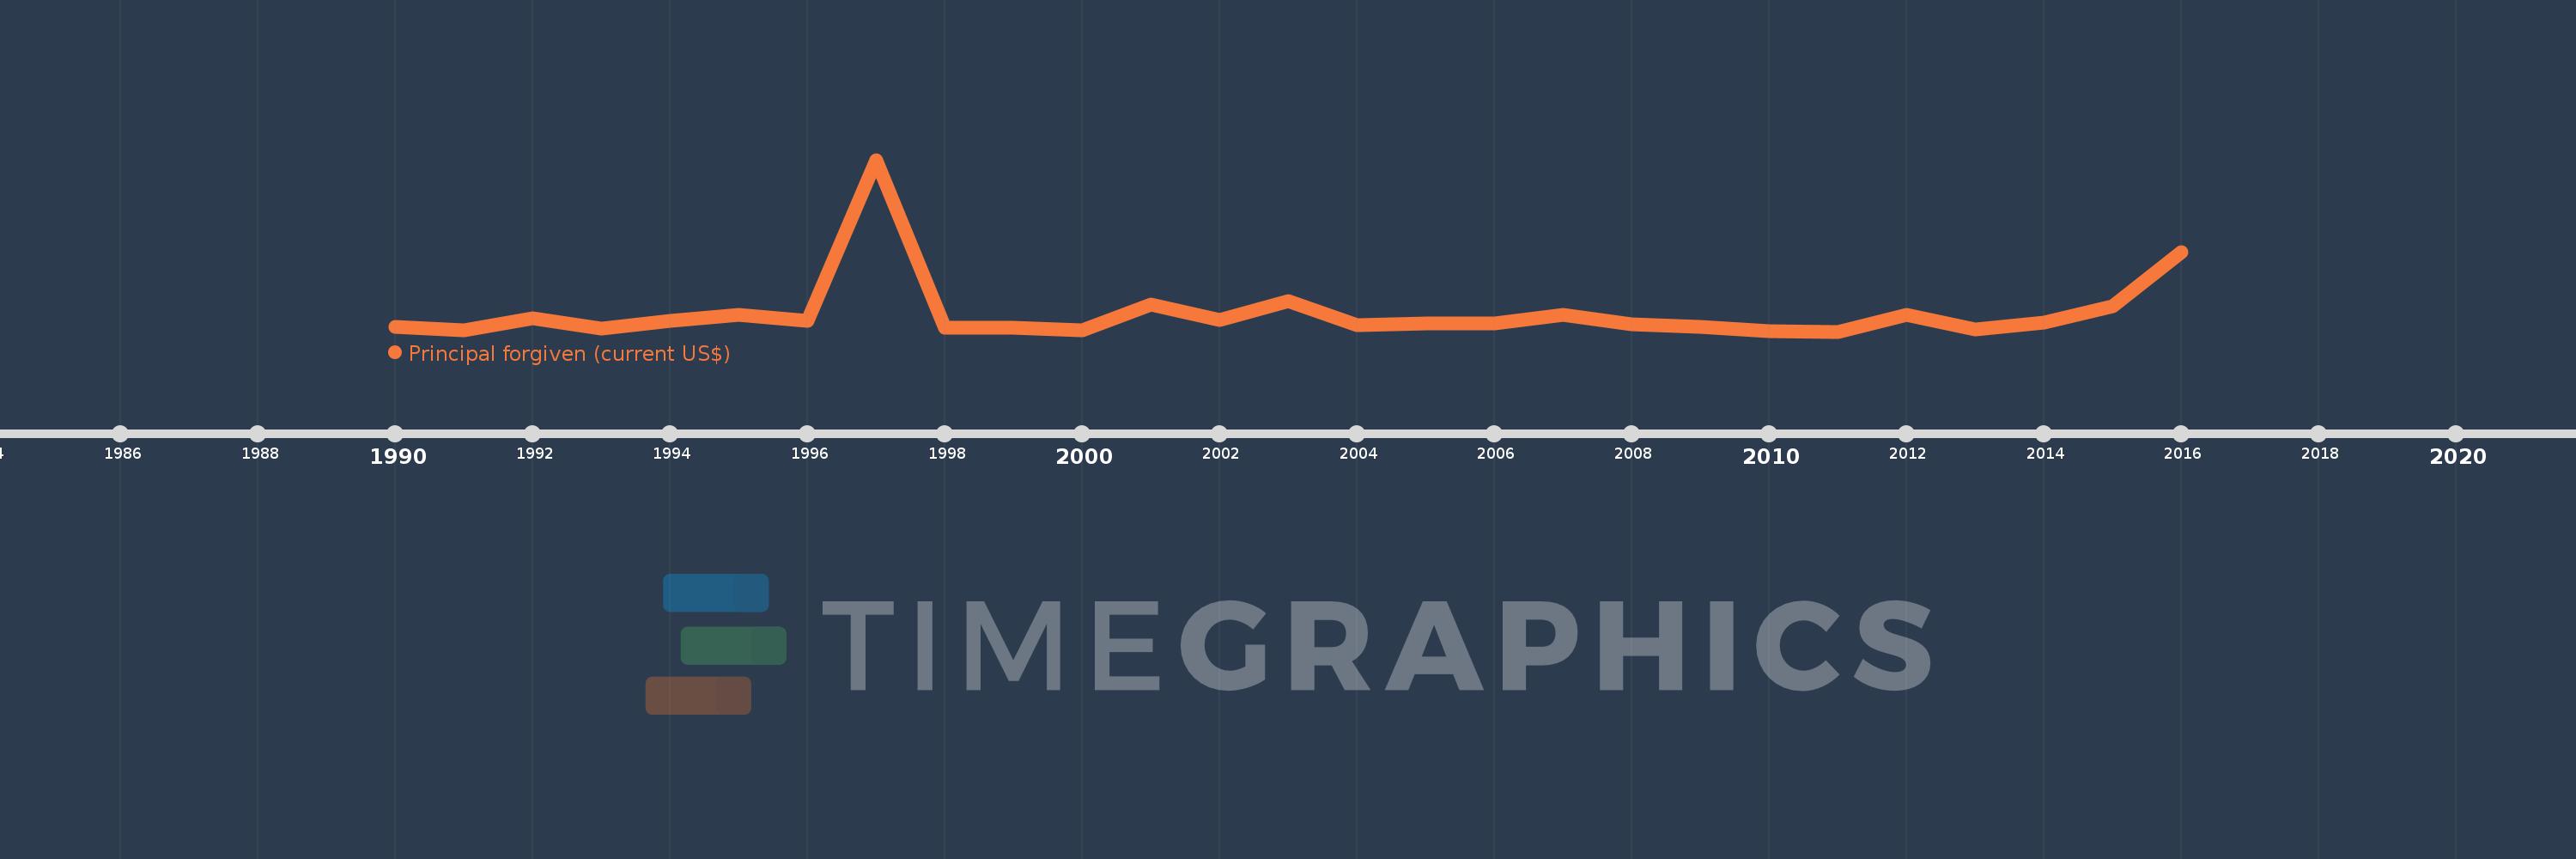
Principal forgiven (current US$)
2016,2015,2014,2013,2012,2011,2010,2009,2008,2007,2006,2005,2004,2003,2002,2001,2000,1999,1998,1997,1996,1995,1994,1993,1992,1991,1990
This statistics in other country:
Timeline:
This timeline shows a graph from 1990 to 2016 of Upper middle income. No data until 1989. Number of actual observations by date: 27.
Source name:
World Development Indicators
Source organization:
World Bank, International Debt Statistics.
Categories, topics:
External Debt
Last updated:
apr 23, 2017
Indicators value changes by year
Minimum:
30.948 mln
jan 1, 2011
Maximum:
5.454 bln
jan 1, 1997
At the date of observation
Value
Absolute change
Change from previous value
jan 1, 1990
168.497 mln
+168.497 mln
0.0%
jan 1, 1991
70.629 mln
-97.868 mln
-58.08%
jan 1, 1992
443.457 mln
+372.828 mln
527.87%
jan 1, 1993
118.836 mln
-324.621 mln
-73.2%
jan 1, 1994
364.336 mln
+245.5 mln
206.59%
jan 1, 1995
563.987 mln
+199.651 mln
54.8%
jan 1, 1996
366.68 mln
-197.307 mln
-34.98%
jan 1, 1997
5.454 bln
+5.088 bln
1.39K%
jan 1, 1998
150.713 mln
-5.304 bln
-97.24%
jan 1, 1999
151.035 mln
+322.0K
0.21%
jan 1, 2000
78.287 mln
-72.748 mln
-48.17%
jan 1, 2001
872.559 mln
+794.272 mln
1.01K%
jan 1, 2002
404.395 mln
-468.164 mln
-53.65%
jan 1, 2003
989.056 mln
+584.661 mln
144.58%
jan 1, 2004
232.762 mln
-756.294 mln
-76.47%
jan 1, 2005
298.663 mln
+65.901 mln
28.31%
jan 1, 2006
294.666 mln
-3.997 mln
-1.34%
jan 1, 2007
563.852 mln
+269.186 mln
91.35%
jan 1, 2008
260.463 mln
-303.389 mln
-53.81%
jan 1, 2009
175.314 mln
-85.149 mln
-32.69%
jan 1, 2010
52.137 mln
-123.177 mln
-70.26%
jan 1, 2011
30.948 mln
-21.189 mln
-40.64%
jan 1, 2012
571.761 mln
+540.813 mln
1.75K%
jan 1, 2013
101.646 mln
-470.115 mln
-82.22%
jan 1, 2014
303.848 mln
+202.202 mln
198.93%
jan 1, 2015
827.05 mln
+523.202 mln
172.19%
jan 1, 2016
2.531 bln
+1.704 bln
206.02%
Ranking of countries by current statistics by years


Comments: